Fig. 4.
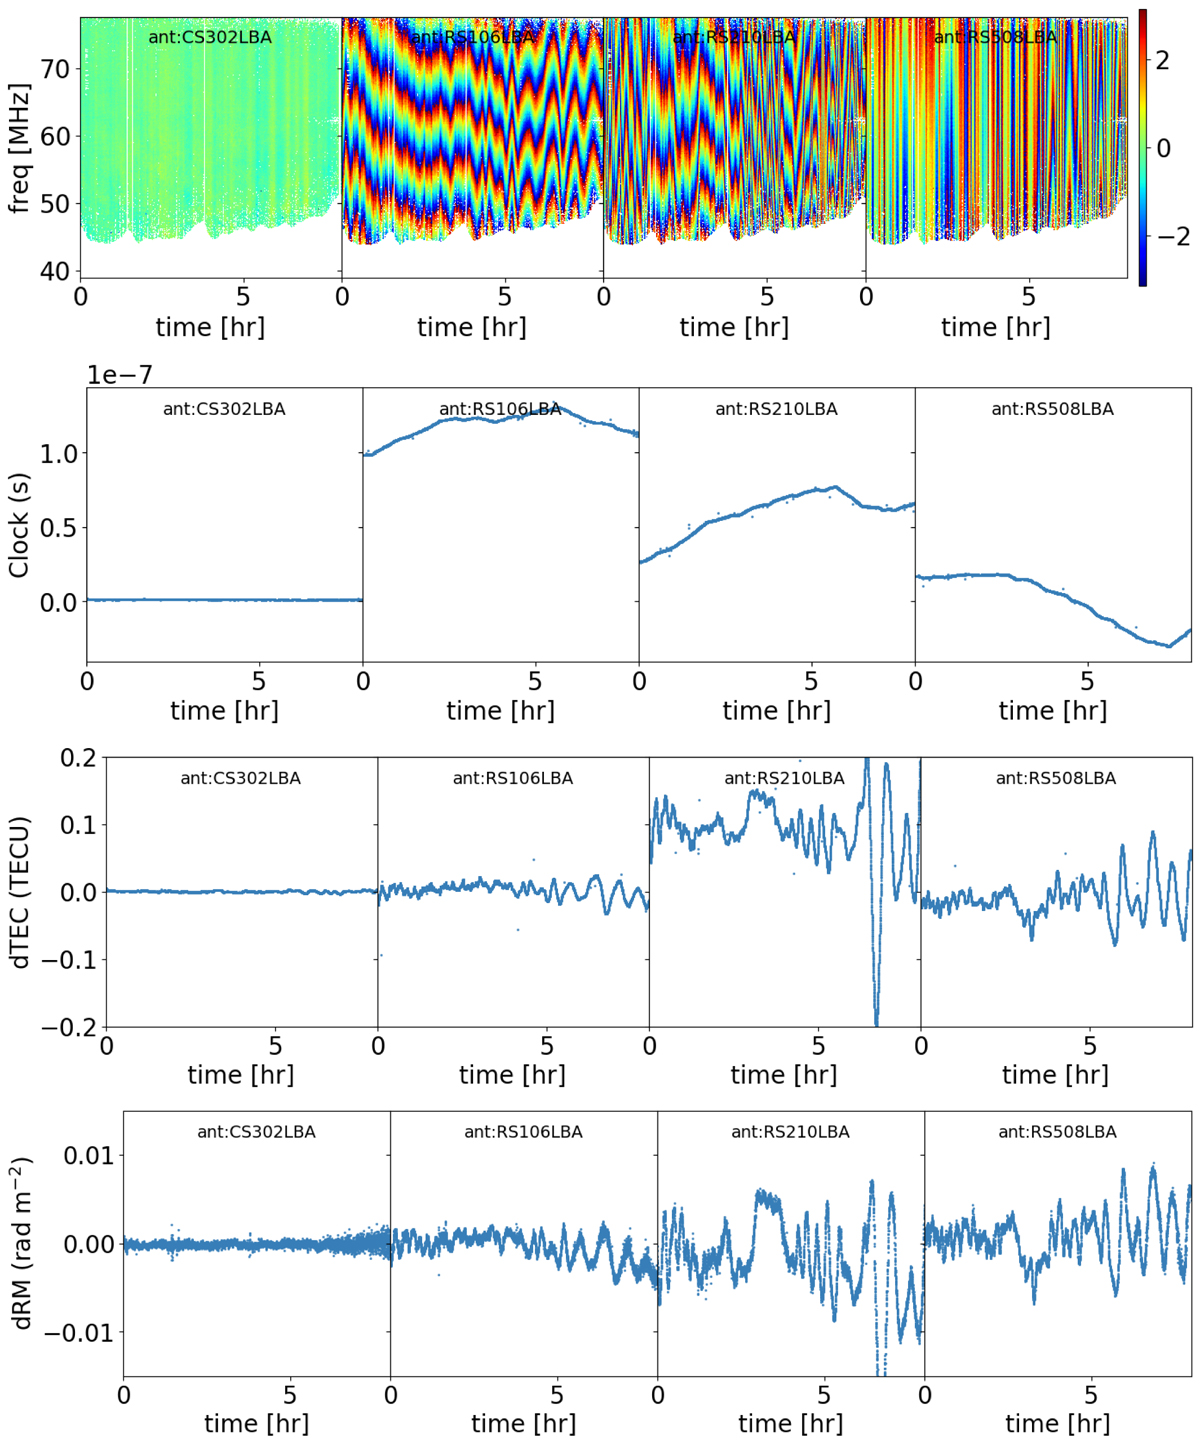
Top panel: phase solutions in radians for four different stations (CS302, RS106, RS210, and RS508) plotted as a function of observing time (x-axis) and frequency (y-axis), referenced to station CS002 at the array centre. Second to fourth panels: clock, differential TEC, and differential Faraday rotation solutions extracted during the calibration process.
Current usage metrics show cumulative count of Article Views (full-text article views including HTML views, PDF and ePub downloads, according to the available data) and Abstracts Views on Vision4Press platform.
Data correspond to usage on the plateform after 2015. The current usage metrics is available 48-96 hours after online publication and is updated daily on week days.
Initial download of the metrics may take a while.