Fig. 9
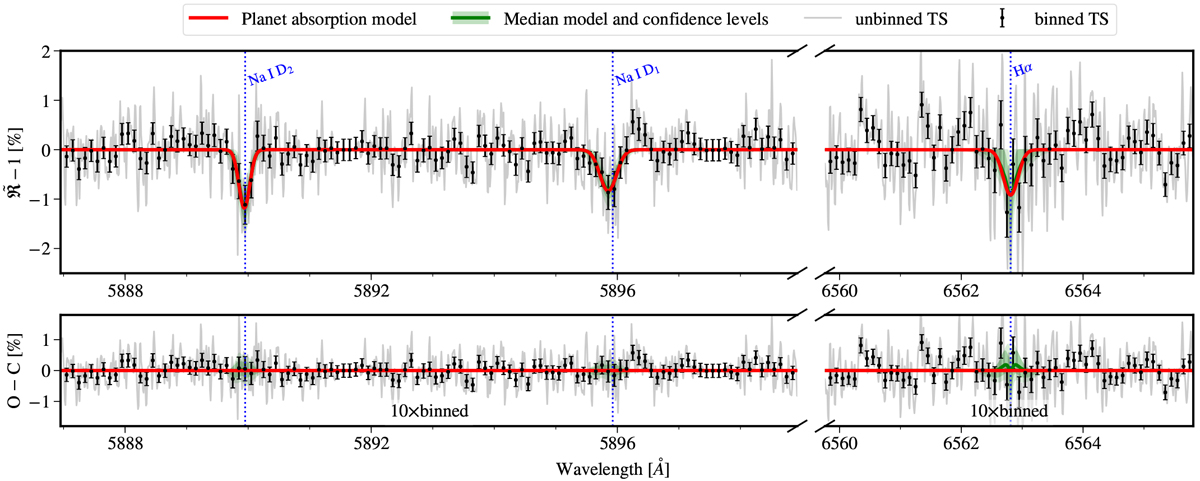
High-resolution transmission spectrum of WASP-21b at the Na doublet and Hα lines. The black circles with error bars show the 10×binned transmissionspectrum, while the gray line shows the 0.01 Å version. The red line presents the best-fit Gaussian function to the Na doublet and Hα lines. The green lines and shaded areas refer to the median and 1σ confidence region of the Gaussian fit. Top panel: transmission spectrum, bottom panel: the one after subtracting the best-fit model.
Current usage metrics show cumulative count of Article Views (full-text article views including HTML views, PDF and ePub downloads, according to the available data) and Abstracts Views on Vision4Press platform.
Data correspond to usage on the plateform after 2015. The current usage metrics is available 48-96 hours after online publication and is updated daily on week days.
Initial download of the metrics may take a while.