Fig. 6
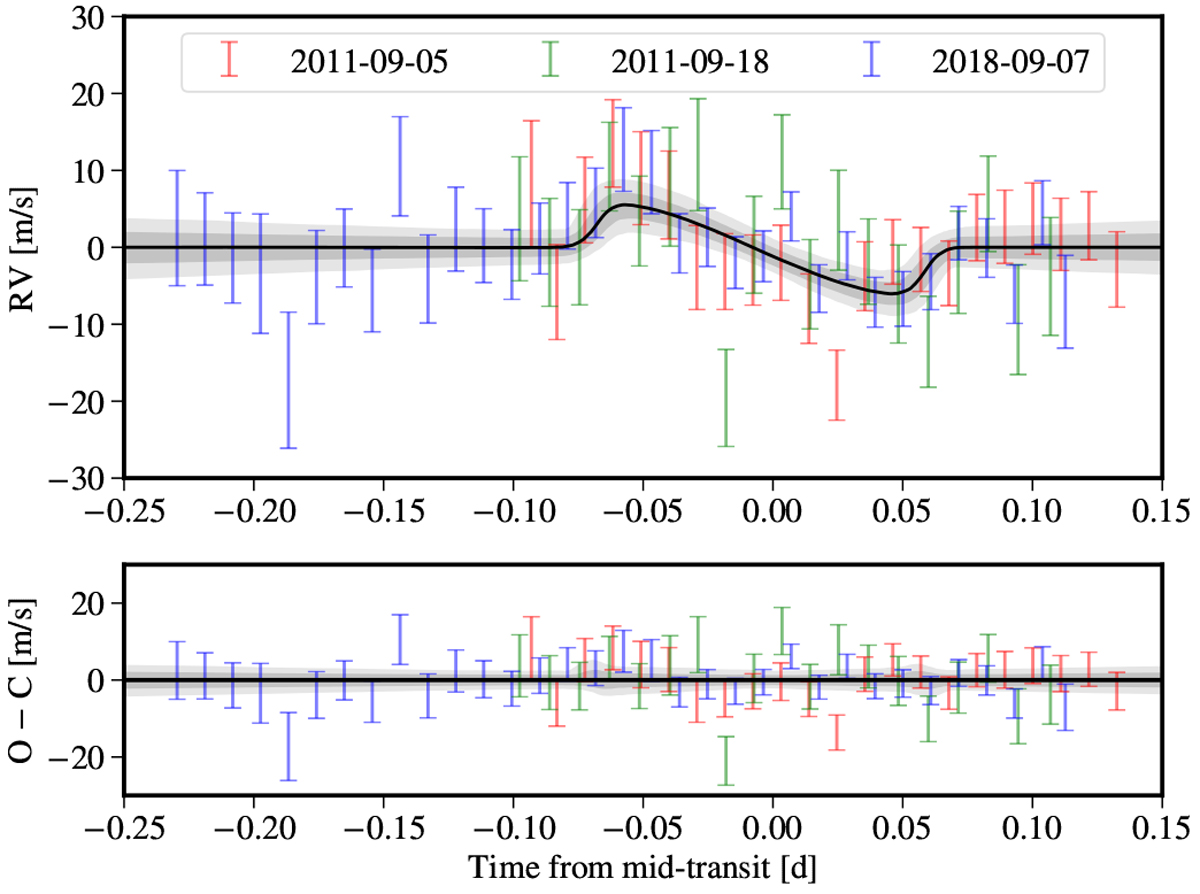
Rossiter-McLaughlin effect in the radial velocity curve of WASP-21. The transits observed on the nights of September 5, 2011, September 18, 2011, and September 7, 2018 are shown in red, green, and blue, respectively. The median RM model and its 1-σ and 2-σ confidence regions are shown in black and gray. Top panel: anomaly caused by the RM effect. Bottom panel: residuals after removing the median RM model.
Current usage metrics show cumulative count of Article Views (full-text article views including HTML views, PDF and ePub downloads, according to the available data) and Abstracts Views on Vision4Press platform.
Data correspond to usage on the plateform after 2015. The current usage metrics is available 48-96 hours after online publication and is updated daily on week days.
Initial download of the metrics may take a while.