Fig. B.1
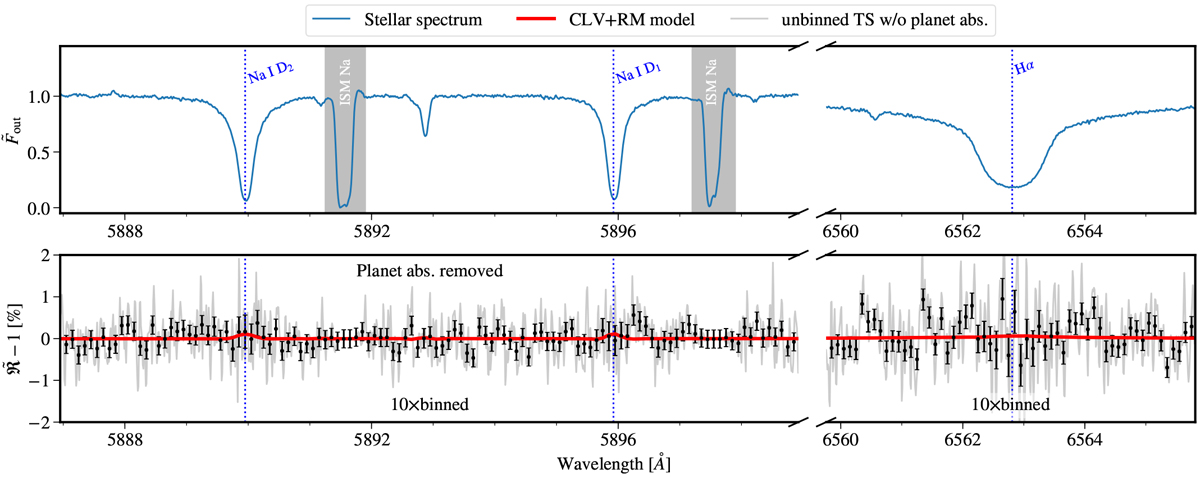
Top panel: out-of-transit master stellar spectrum at the Na doublet and Hα lines. The strong interstellar Na absorption, indicated by the gray shadow, can be noticed on the red side of the stellar Na absorption. The wavelength is in the stellar rest frame. Bottom panel: transmission spectrum without the CLV and RM correction. The best-fit planet absorption presented in Fig. 9 has been removed. The red line shows the combined CLV and RM model.
Current usage metrics show cumulative count of Article Views (full-text article views including HTML views, PDF and ePub downloads, according to the available data) and Abstracts Views on Vision4Press platform.
Data correspond to usage on the plateform after 2015. The current usage metrics is available 48-96 hours after online publication and is updated daily on week days.
Initial download of the metrics may take a while.