Fig. A.1
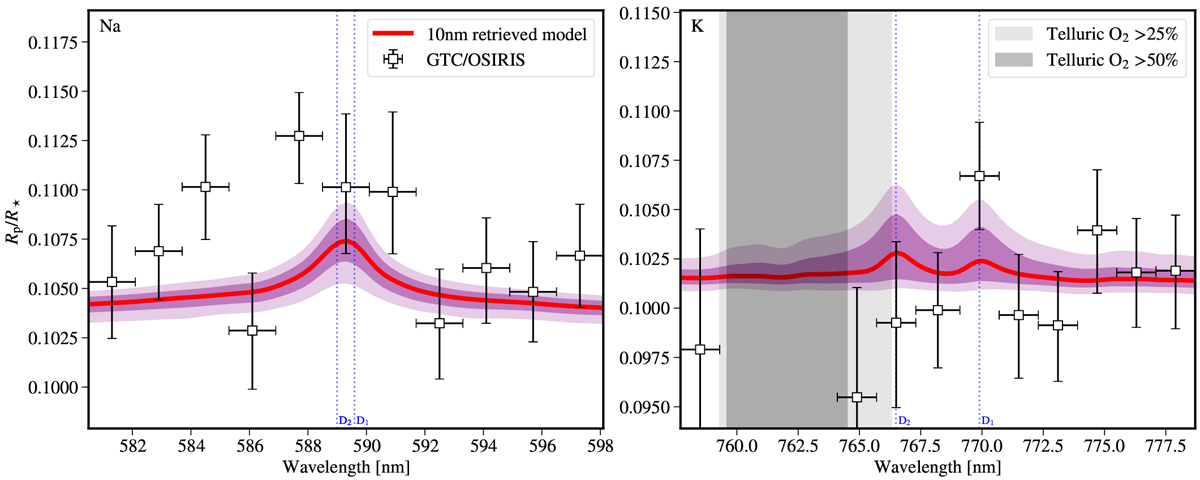
GTC/OSIRIS 16 Å bin transmission spectrum, zoomed at the Na (left) and K (right) doublets. The red line along with the purple shaded regions show the best model and its 1-σ/2-σ confidence levels retrieved from the 10 nm bin transmission spectrum. While it is too noisy to claim detections of the Na and K line cores, the data indeed hint at possible excess absorption at the Na doublet and the K D1 line. The K D2 line is located in the telluric oxygen-A band.
Current usage metrics show cumulative count of Article Views (full-text article views including HTML views, PDF and ePub downloads, according to the available data) and Abstracts Views on Vision4Press platform.
Data correspond to usage on the plateform after 2015. The current usage metrics is available 48-96 hours after online publication and is updated daily on week days.
Initial download of the metrics may take a while.