Fig. 11
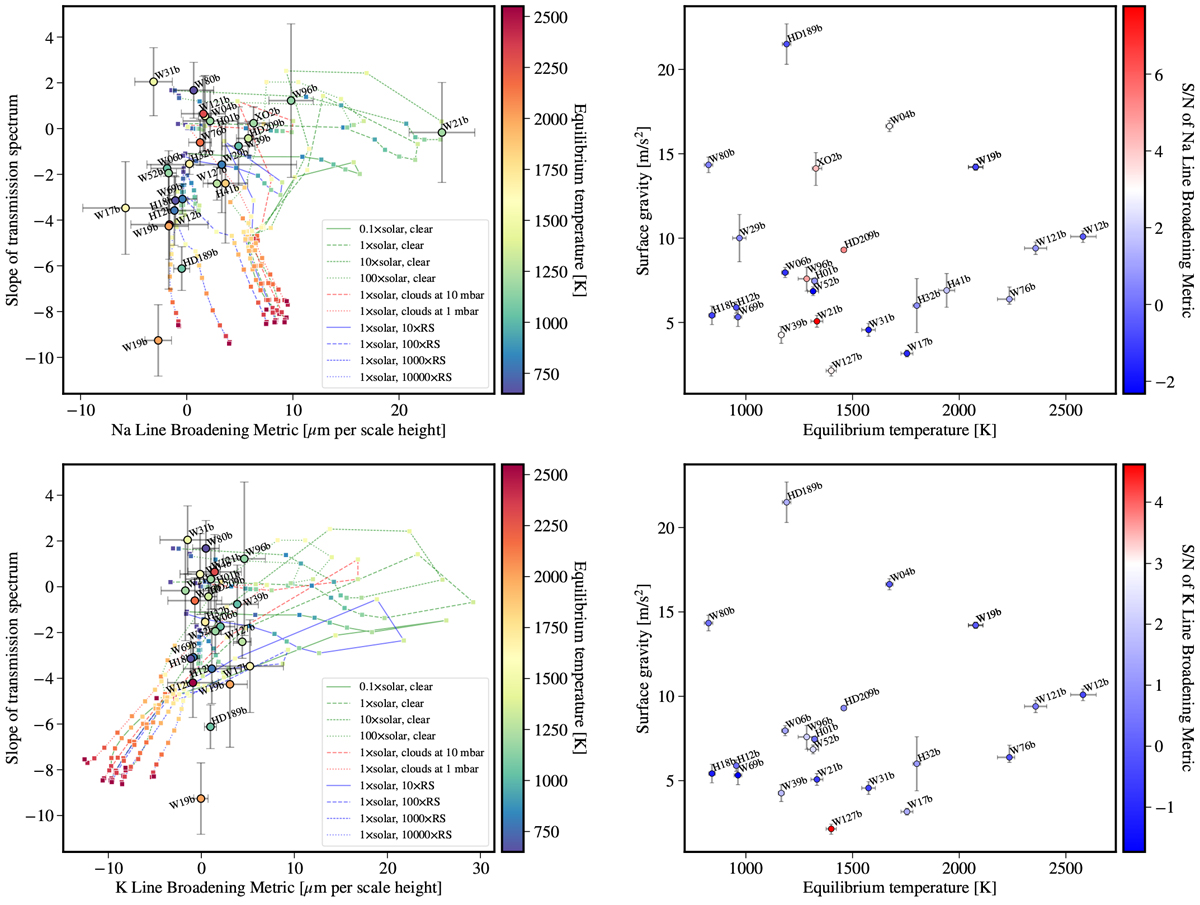
Left panels: distribution of hot Jupiters characterized by low-resolution optical transmission spectroscopy on the plane of spectral slope versus line broadening metric. The first and second rows show the metric for Na and K, respectively. The colored lines show the corresponding values measured in the fiducial models, which connect models of different temperatures in the same group, that is, different metallicities, different cloud conditions, or different RS enhancements. Right panels: distribution of the same hot Jupiters on the plane of planetary surface gravity versus equilibrium temperature. They are color-coded by the S/N of the measured line broadening metric. The white part of the color bar is centered at S∕N = 3.
Current usage metrics show cumulative count of Article Views (full-text article views including HTML views, PDF and ePub downloads, according to the available data) and Abstracts Views on Vision4Press platform.
Data correspond to usage on the plateform after 2015. The current usage metrics is available 48-96 hours after online publication and is updated daily on week days.
Initial download of the metrics may take a while.