Free Access
Fig. 10
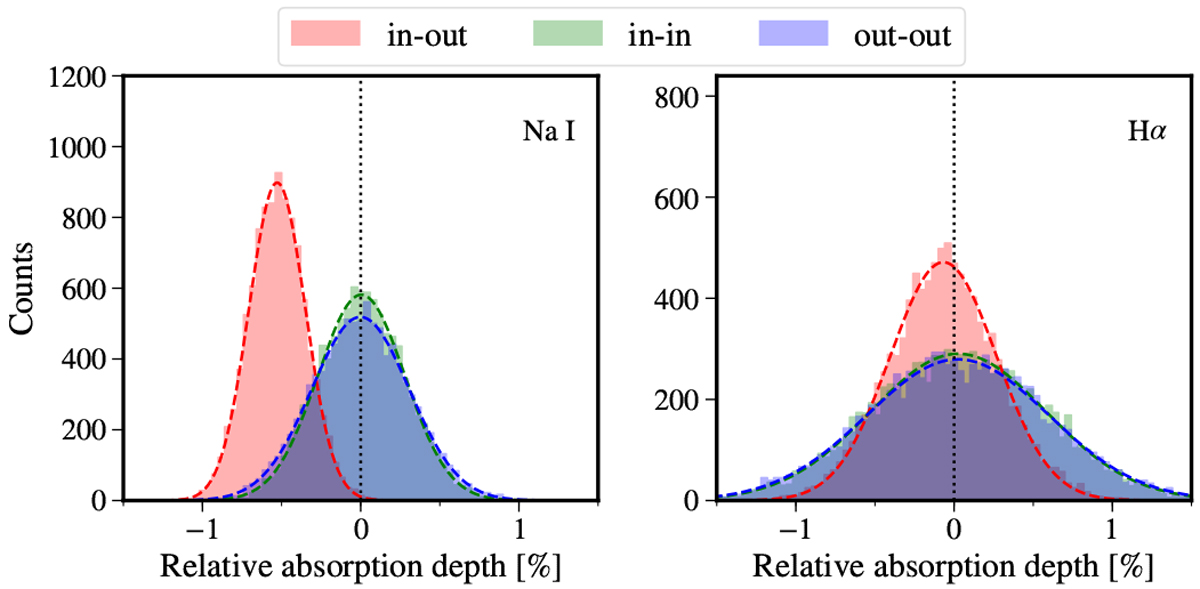
Absorption depths measured in mock transmission spectra created in the empirical Monte Carlo simulation (left: Na, right: Hα). The distribution of the scenarios “in-out”, “in-in”, and “out-out” are coded in red, green, and blue, respectively. We refer the reader to Sect. 4.2 for details.
Current usage metrics show cumulative count of Article Views (full-text article views including HTML views, PDF and ePub downloads, according to the available data) and Abstracts Views on Vision4Press platform.
Data correspond to usage on the plateform after 2015. The current usage metrics is available 48-96 hours after online publication and is updated daily on week days.
Initial download of the metrics may take a while.