Fig. 4.
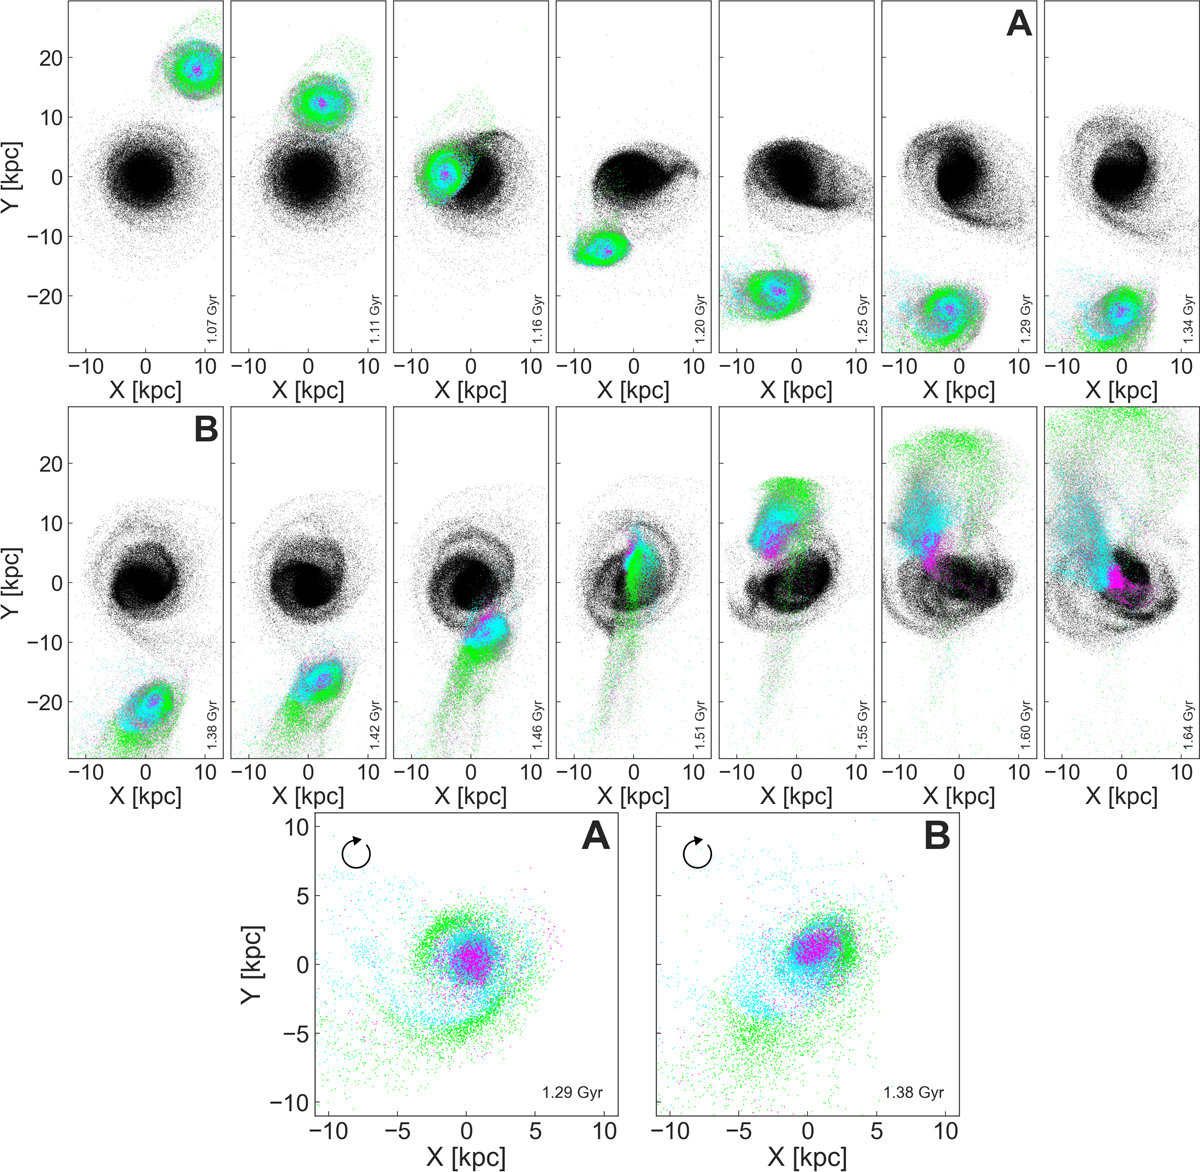
Evolution of the satellite around the time of the second pericentric passage, which takes place at t ≈ 1.5 Gyr. The colours distinguish the three structures identified in the final orbital distribution of the debris (see Fig. 3) and evidence the complexity of the mass loss process. This is clearly seen in the bottom two panels, which zoom in on the satellite at two specific times, and where its spin is indicated by a curled arrow.
Current usage metrics show cumulative count of Article Views (full-text article views including HTML views, PDF and ePub downloads, according to the available data) and Abstracts Views on Vision4Press platform.
Data correspond to usage on the plateform after 2015. The current usage metrics is available 48-96 hours after online publication and is updated daily on week days.
Initial download of the metrics may take a while.