Fig. 1.
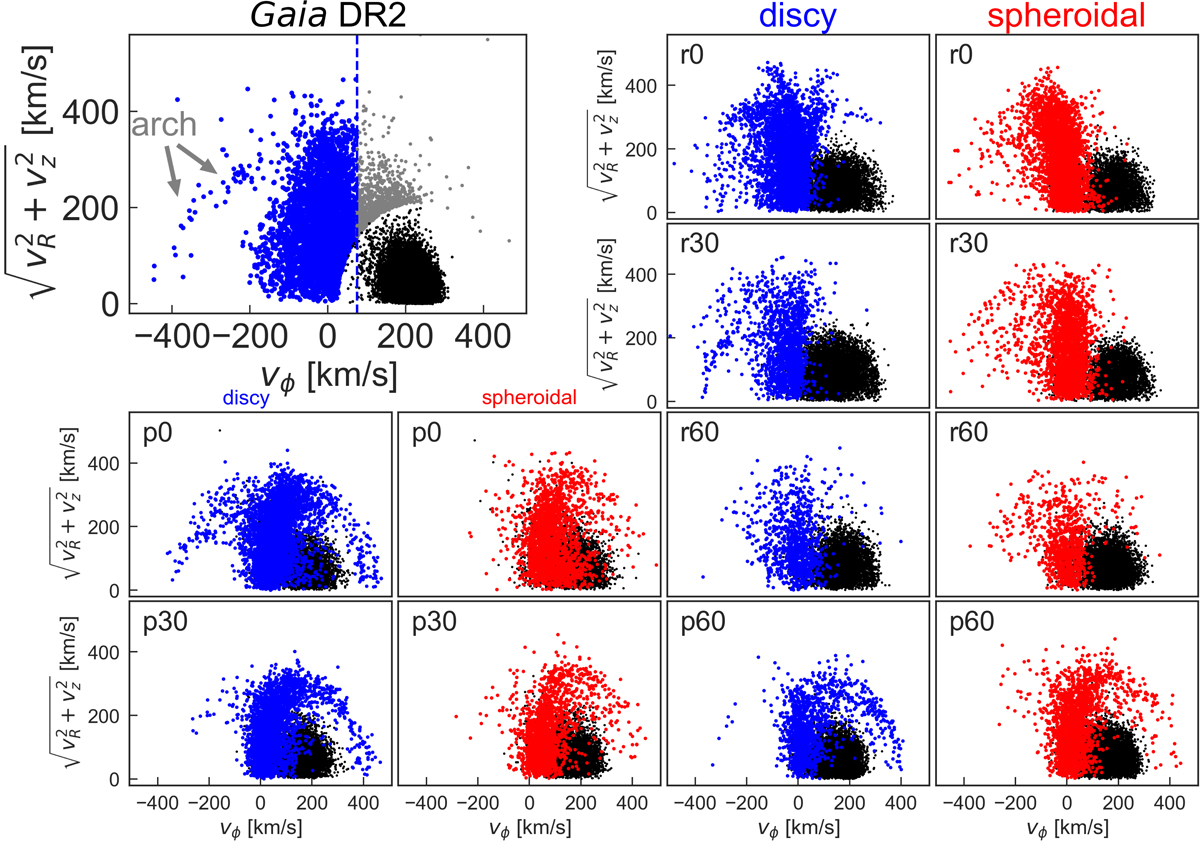
Velocity distribution of the local (< 1 kpc) stellar halo using Gaia data (large panel) and in the Villalobos & Helmi (2008) simulations, where the small panels indicate the orbital inclination (0°, 30° or, 60°) and whether the merger was prograde or retrograde. Stellar particles from the discy (spherical) satellites are shown in blue (red). The distinct velocity distributions of these stars betray the progenitor’s properties and the merger geometry.
Current usage metrics show cumulative count of Article Views (full-text article views including HTML views, PDF and ePub downloads, according to the available data) and Abstracts Views on Vision4Press platform.
Data correspond to usage on the plateform after 2015. The current usage metrics is available 48-96 hours after online publication and is updated daily on week days.
Initial download of the metrics may take a while.