Fig. 8.
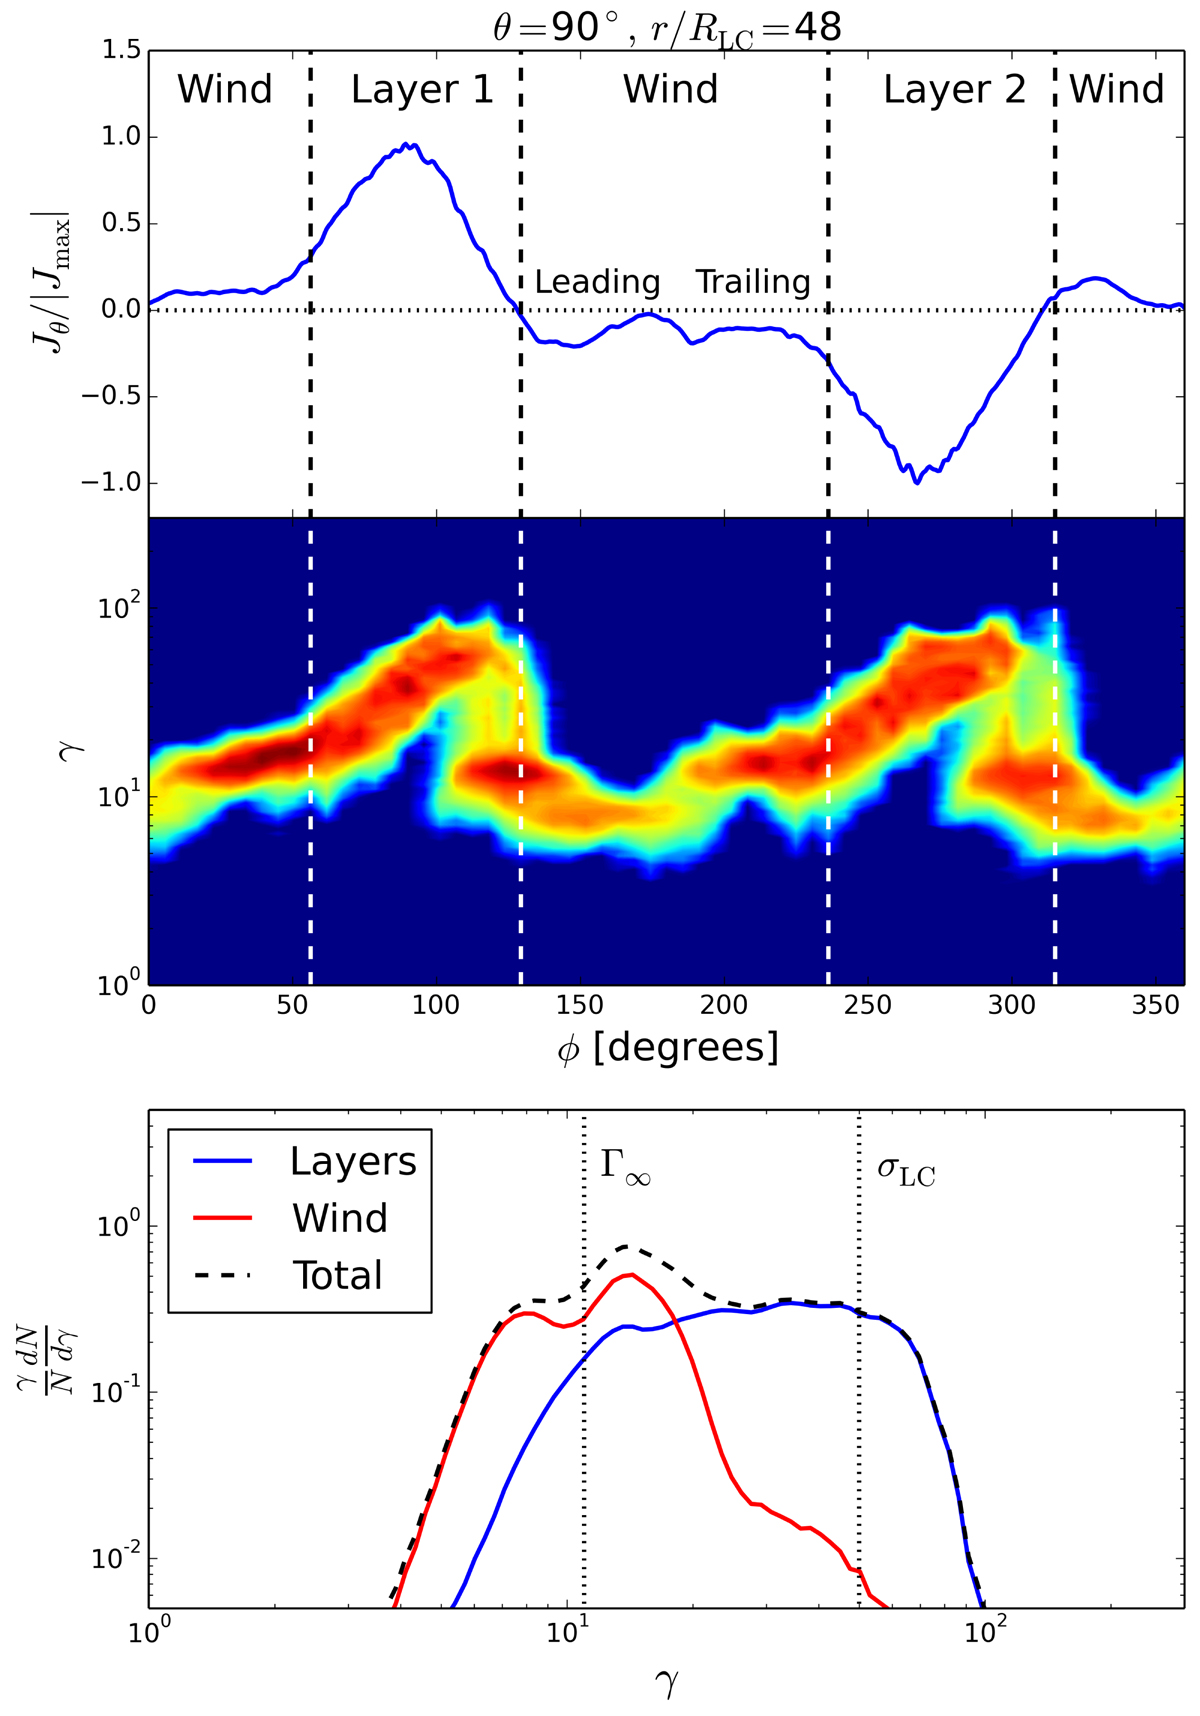
Top: ϕ-profile of the normalized current density flowing along the θ-direction in the equatorial plane (θ = 90°) for r = 48 RLC and χ = 60°. The locations of the current sheets and wind regions are labeled “Layer 1,” “Layer 2,” and “wind,” respectively. Middle: corresponding ϕ-resolved particle energy spectrum. Bottom: decomposition of the total particle spectrum in the striped region (dashed black line) into a wind component (solid red line) and a layers component (solid blue line). The vertical dotted lines show γ = Γ∞ ≈ 11 and γ = σLC ≈ 50.
Current usage metrics show cumulative count of Article Views (full-text article views including HTML views, PDF and ePub downloads, according to the available data) and Abstracts Views on Vision4Press platform.
Data correspond to usage on the plateform after 2015. The current usage metrics is available 48-96 hours after online publication and is updated daily on week days.
Initial download of the metrics may take a while.