Fig. 2.
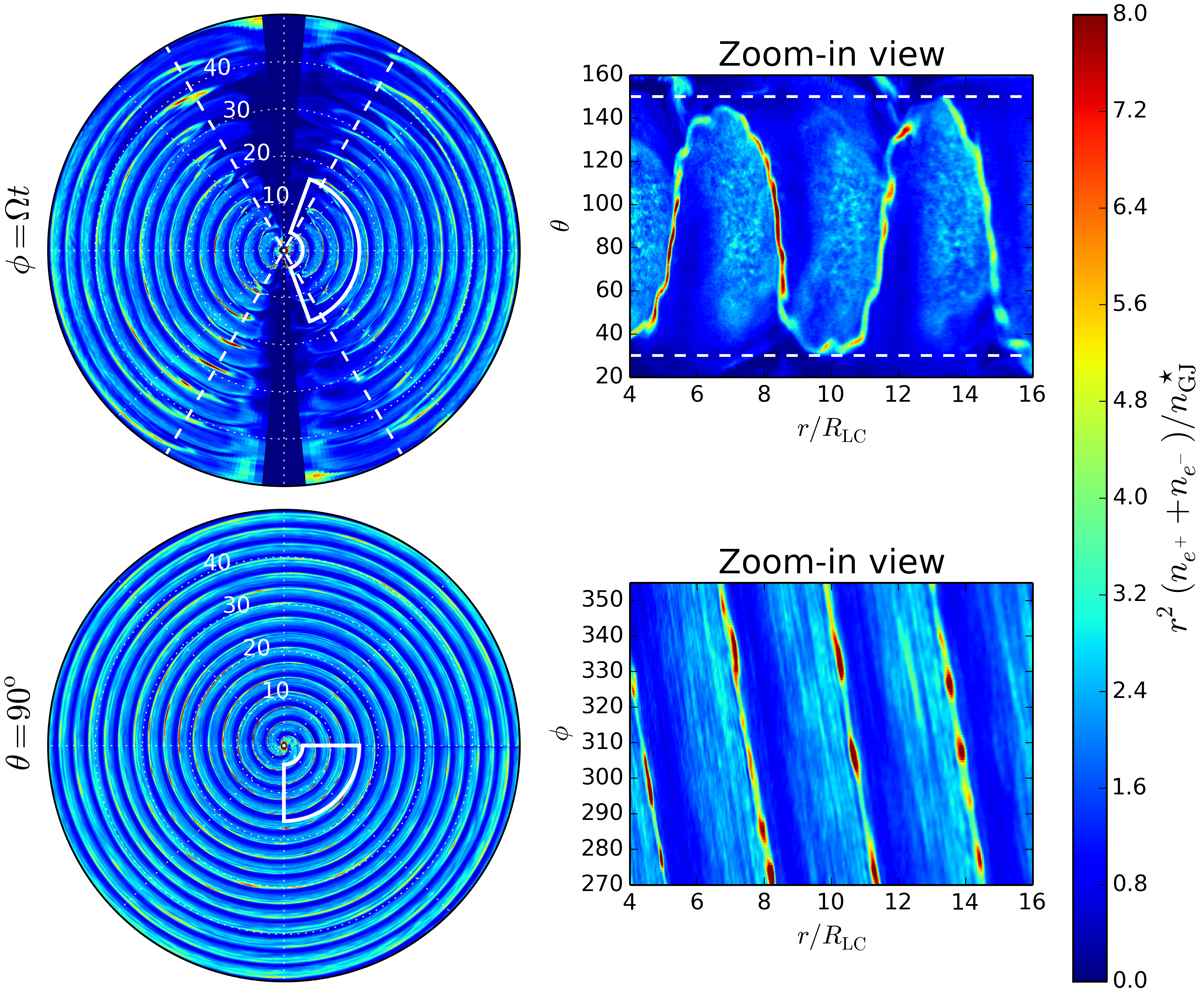
2D slices of the plasma density ![]() for χ = 60°. Top: rθ-plane containing the magnetic axis at the phase ϕ = Ωt. Bottom: rϕ-plane at the equator (θ = 90°). The radius is expressed in units of RLC. Right panels: zoomed-in views of the regions delimited by the white boxes drawn on the left panels. The striped wind region is contained within π/2 − χ ≤ θ ≤ π/2 + χ (white dashed lines).
for χ = 60°. Top: rθ-plane containing the magnetic axis at the phase ϕ = Ωt. Bottom: rϕ-plane at the equator (θ = 90°). The radius is expressed in units of RLC. Right panels: zoomed-in views of the regions delimited by the white boxes drawn on the left panels. The striped wind region is contained within π/2 − χ ≤ θ ≤ π/2 + χ (white dashed lines).
Current usage metrics show cumulative count of Article Views (full-text article views including HTML views, PDF and ePub downloads, according to the available data) and Abstracts Views on Vision4Press platform.
Data correspond to usage on the plateform after 2015. The current usage metrics is available 48-96 hours after online publication and is updated daily on week days.
Initial download of the metrics may take a while.