Open Access
Fig. 1.
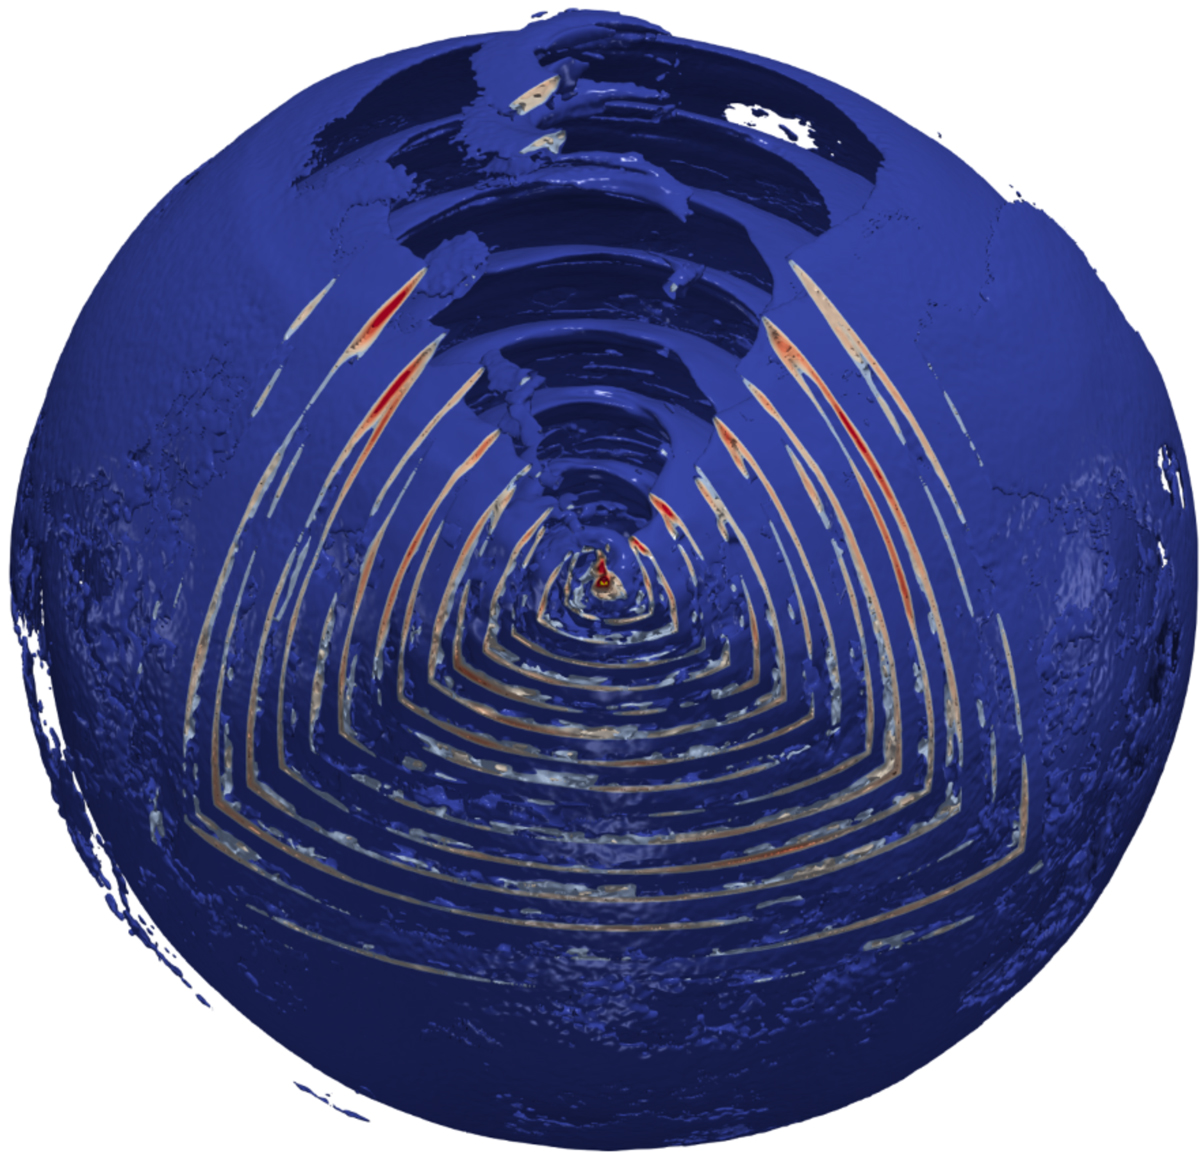
3D rendering of plasma density isosurfaces for χ = 60° from the star surface (yellow dot at the center) up to 50 RLC. A spherical wedge has been removed to show the internal structure of the striped wind.
Current usage metrics show cumulative count of Article Views (full-text article views including HTML views, PDF and ePub downloads, according to the available data) and Abstracts Views on Vision4Press platform.
Data correspond to usage on the plateform after 2015. The current usage metrics is available 48-96 hours after online publication and is updated daily on week days.
Initial download of the metrics may take a while.