Fig. A.2
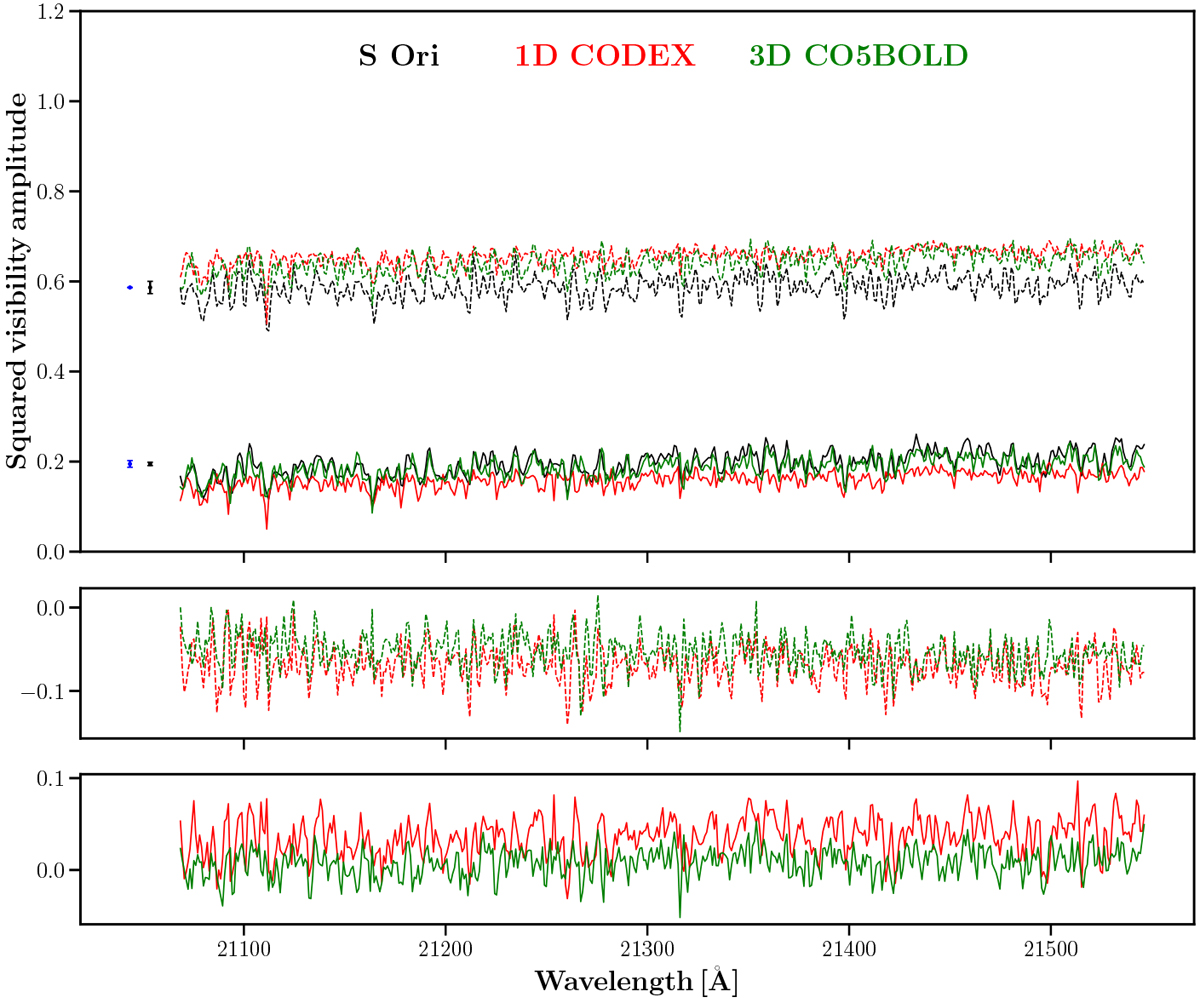
Top panel: squared visibility amplitudes of S Ori (black) obtained with the 2.133 μm AMBER setting (Table 1). They are compared to the best-fit 1D CODEX snapshot (red) and the best-fit snapshot from the 3D RHD CO5BOLD simulation (green), described in Sects. 4.2 and 4.3, respectively. Only data corresponding to the short (G0-E0, dashed lines) and medium (H0-G0, solid lines) AMBER baselines are shown. Average errorbars (mainly arising from the uncertainty on the angular diameter of the calibrator) of AMBER observations are shown in black on the left side of each visibility spectrum. Systematic errorbars associated with the percentage of the best frames being averaged (see Sect. 2) are shown in blue. Errorbars which are too small todiscern are shown as ten-fold errors and labeled accordingly. Middle panel: residuals between the AMBER and model squared visibilities for the short baseline. The color coding is the same as in the top panel. Bottom panel: same as the middle panel, but for the medium baseline.
Current usage metrics show cumulative count of Article Views (full-text article views including HTML views, PDF and ePub downloads, according to the available data) and Abstracts Views on Vision4Press platform.
Data correspond to usage on the plateform after 2015. The current usage metrics is available 48-96 hours after online publication and is updated daily on week days.
Initial download of the metrics may take a while.