Fig. 5
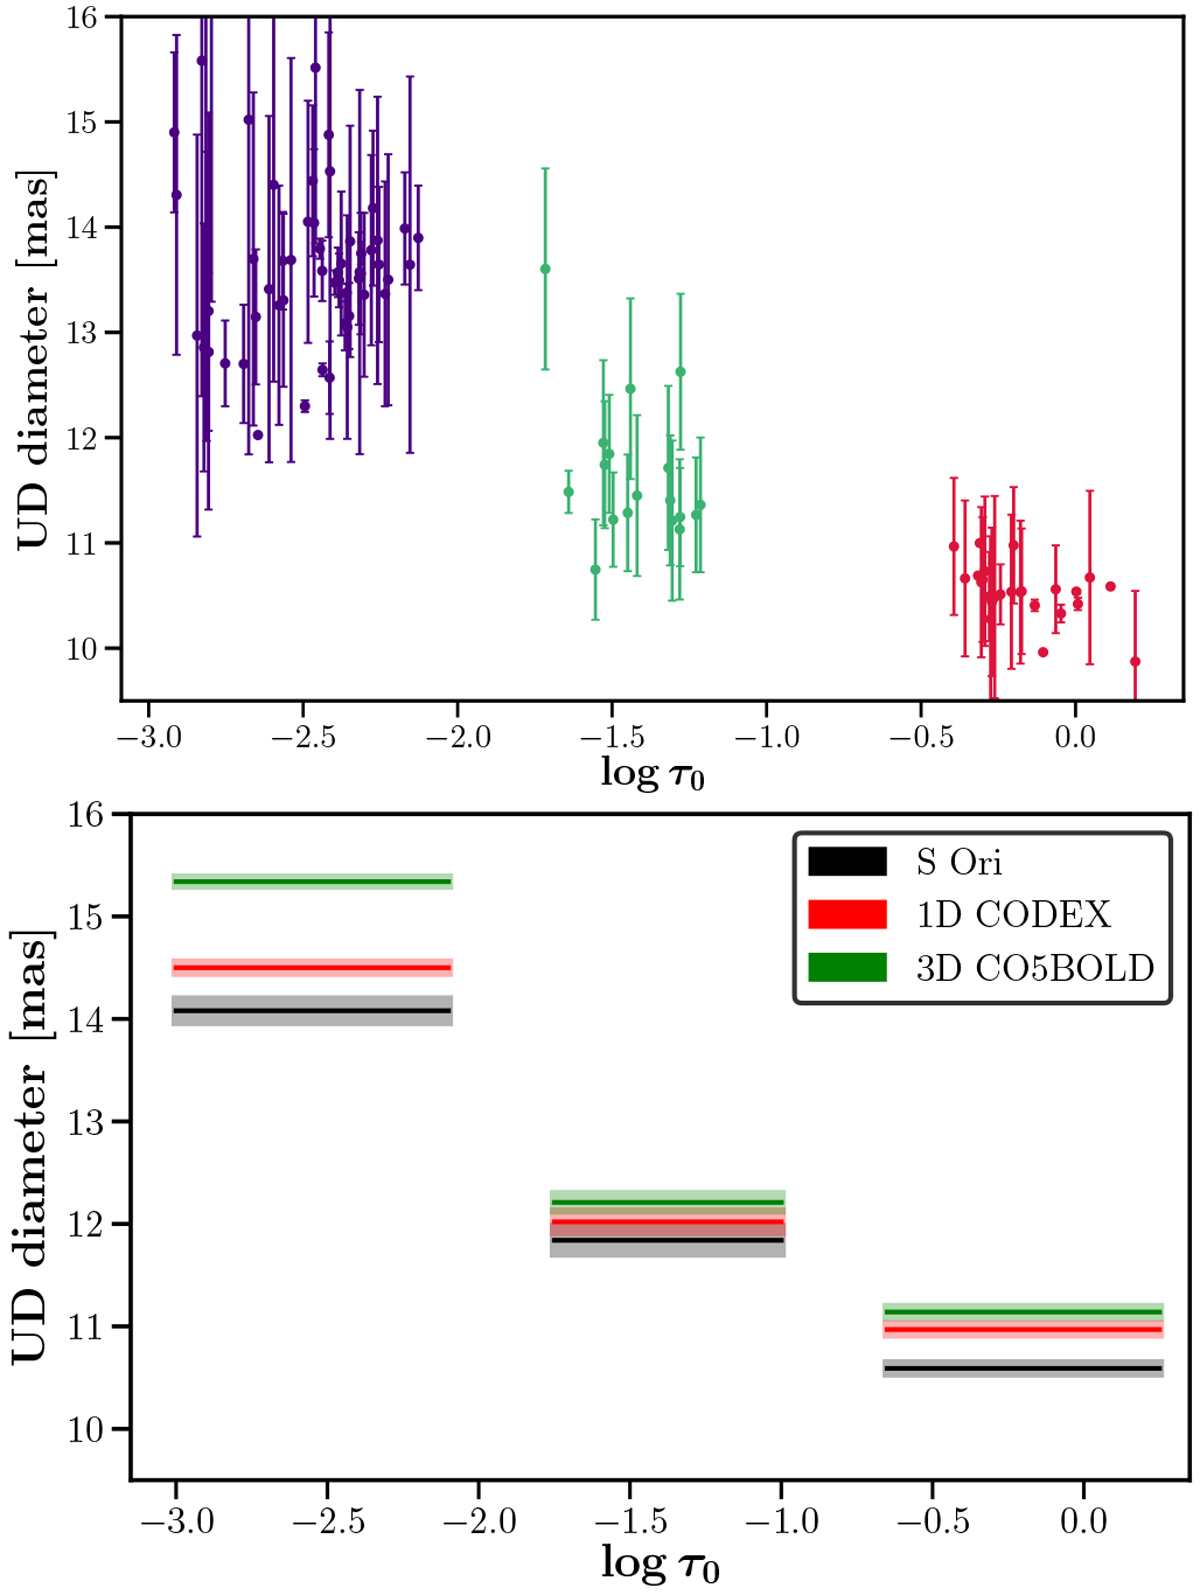
Top panel: UD angular diameters of S Ori for each line of a mask versus their corresponding reference optical depths (Fig. 3). The color coding is the same as in Figs. 3 and 4. Bottom panel: UD angular diameters of S Ori (black), best-fit 1D CODEX snapshot (red), and best-fit snapshot from the 3D RHD simulation (green) from Table 4 for the different tomographic masks versus their corresponding reference optical depths (Table 2). The errorbars are shown as shaded areas.
Current usage metrics show cumulative count of Article Views (full-text article views including HTML views, PDF and ePub downloads, according to the available data) and Abstracts Views on Vision4Press platform.
Data correspond to usage on the plateform after 2015. The current usage metrics is available 48-96 hours after online publication and is updated daily on week days.
Initial download of the metrics may take a while.