Fig. 4
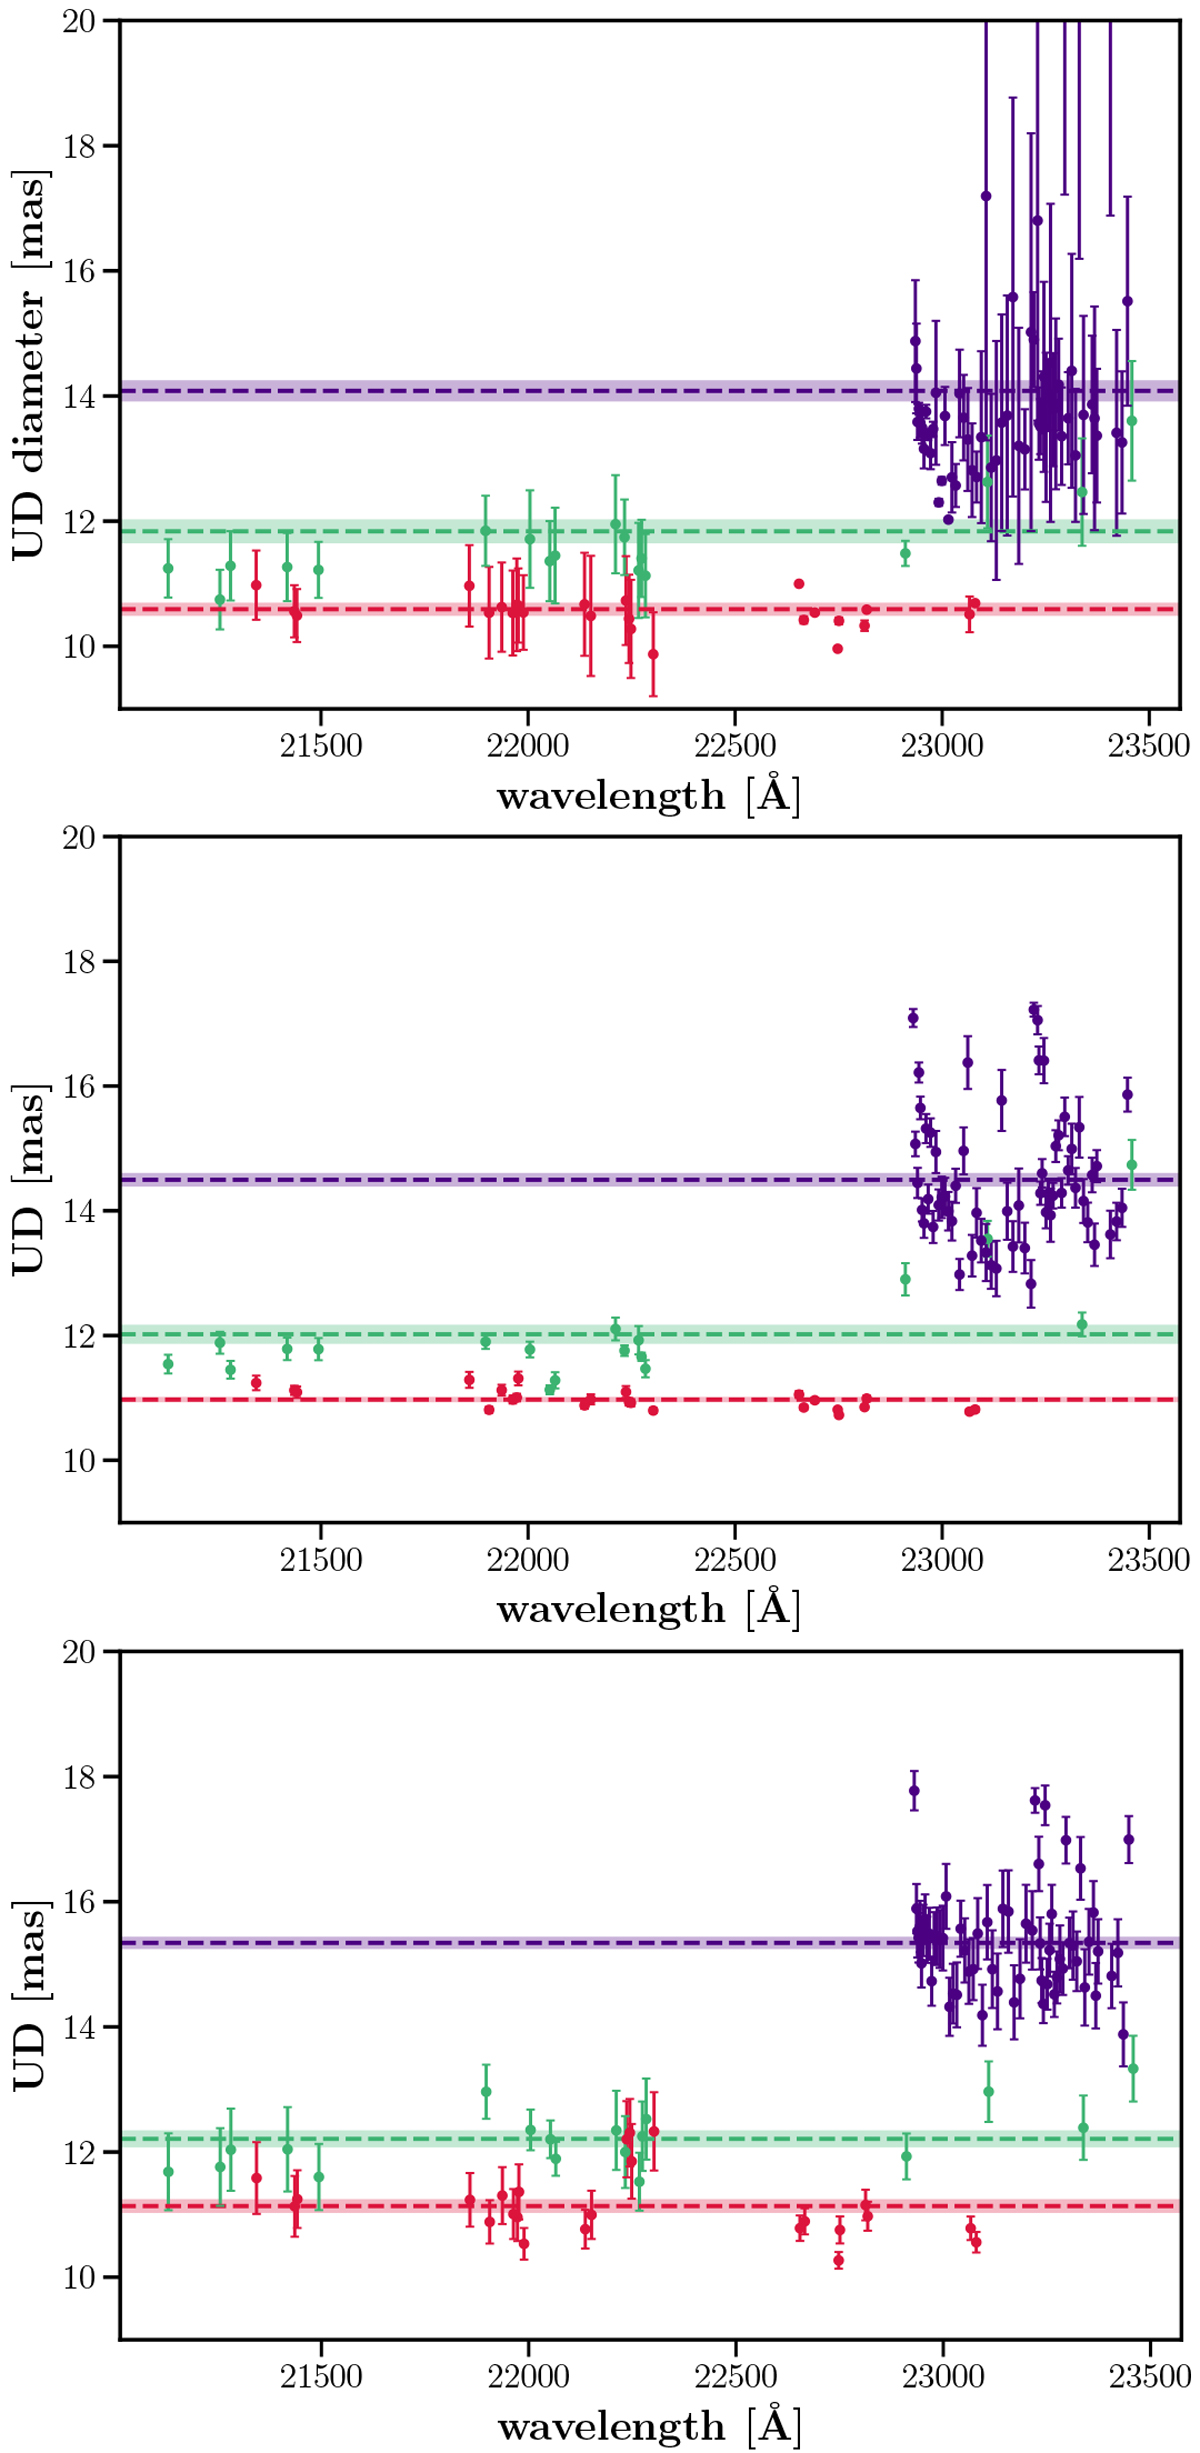
Top panel: Angular diameters obtained from the fit of AMBER visibilities with a UD model, separately for each line of a mask. Lines belonging to a given mask are coded in the corresponding color (see Fig. 3). Dashed horizontal lines correspond to the UD diameters obtained from a UD-model fit of all AMBER visibilities contributing to a given mask at once. Shaded areas correspond to errorbars. Middle panel: same as top panel for the best-matching 1D CODEX model (see Sect. 4.2). Bottom panel: same as top panel for the best-matching snapshot from the 3D RHD simulation (see Sect. 4.3).
Current usage metrics show cumulative count of Article Views (full-text article views including HTML views, PDF and ePub downloads, according to the available data) and Abstracts Views on Vision4Press platform.
Data correspond to usage on the plateform after 2015. The current usage metrics is available 48-96 hours after online publication and is updated daily on week days.
Initial download of the metrics may take a while.