Fig. A.6
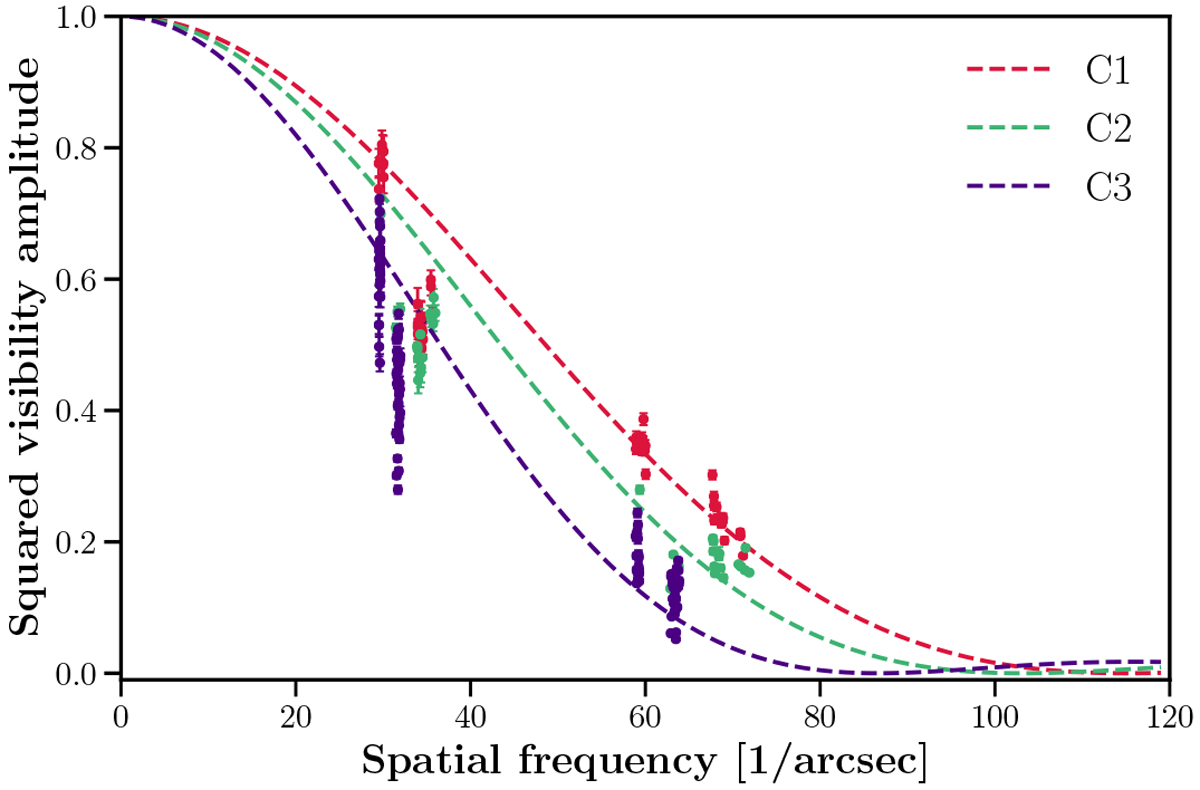
UD fit of VLTI/AMBER visibilities of S Ori (dashed lines) for the different tomographic masks. Two clusters of points correspond to two baselines: small (G0-E0) and medium (H0-G0). Each point corresponds to a squared visibility extracted ata wavelength contributing to a given tomographic mask. Colors correspond to different masks.
Current usage metrics show cumulative count of Article Views (full-text article views including HTML views, PDF and ePub downloads, according to the available data) and Abstracts Views on Vision4Press platform.
Data correspond to usage on the plateform after 2015. The current usage metrics is available 48-96 hours after online publication and is updated daily on week days.
Initial download of the metrics may take a while.