Fig. 7
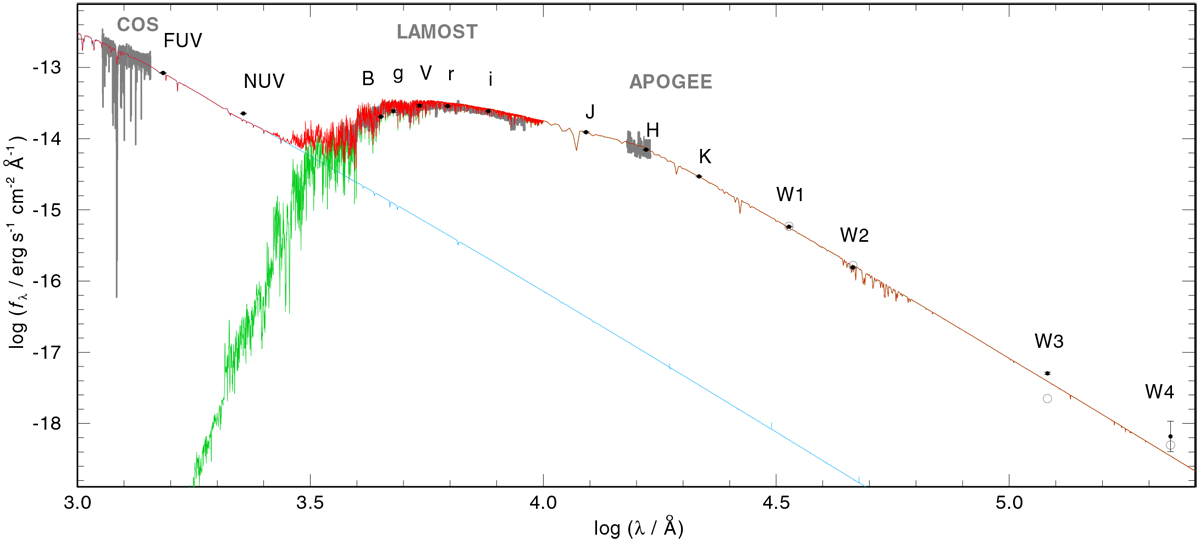
Fit to the SED of UCAC2 46706450. HST/COS, LAMOST (normalized to r-band magnitude),and APOGEE spectra are shown in gray. The model fluxes from the hot WD and the K-type subgiant are shown in light blue and green, respectively. The combined model flux is shown in red. The black dots indicate filter-averaged fluxes that were converted from observed magnitudes. Gray open circles indicate WISE fluxes for which the flux correction was not taken into account.
Current usage metrics show cumulative count of Article Views (full-text article views including HTML views, PDF and ePub downloads, according to the available data) and Abstracts Views on Vision4Press platform.
Data correspond to usage on the plateform after 2015. The current usage metrics is available 48-96 hours after online publication and is updated daily on week days.
Initial download of the metrics may take a while.