Fig. 3
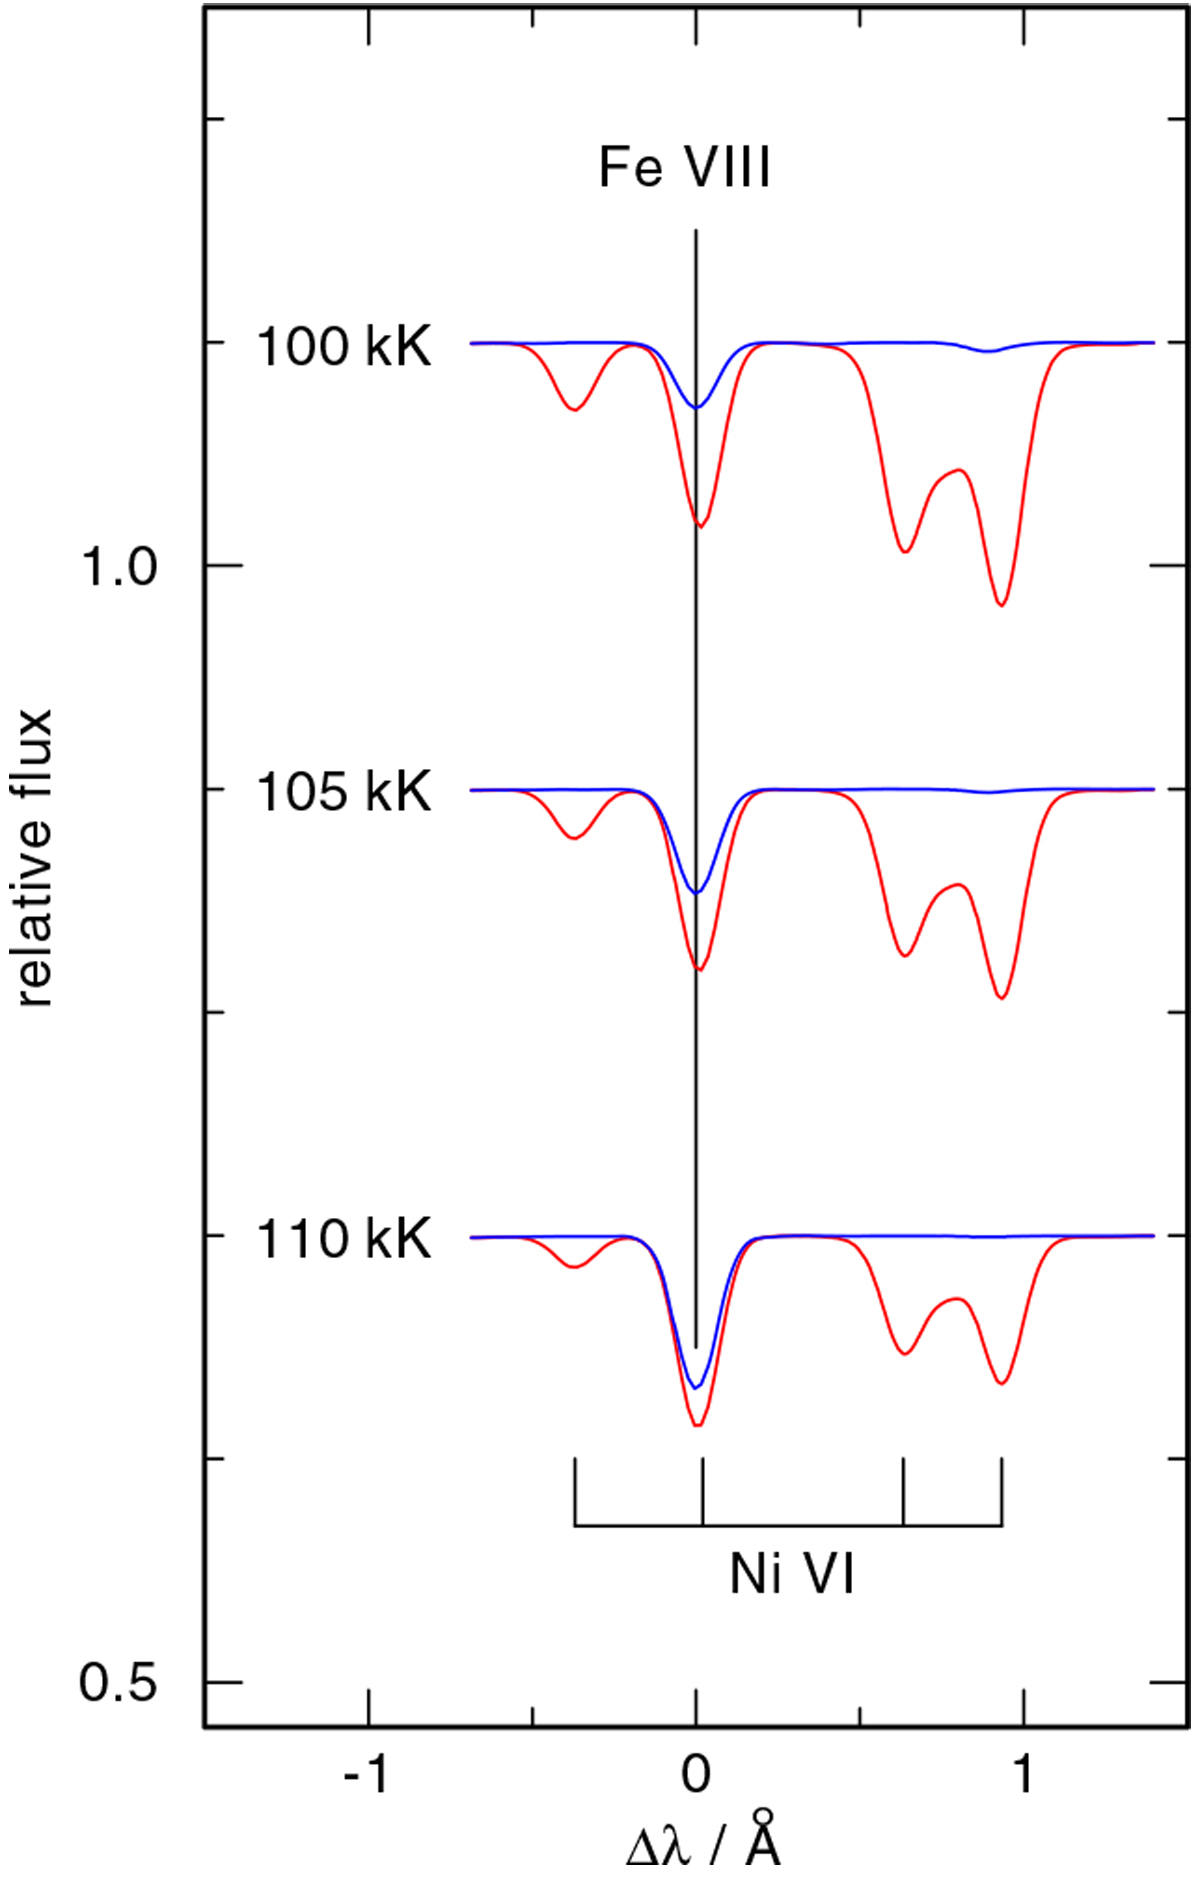
Effect of increasing temperature on the Ni VI/Fe VIII line blend at 1148.2 Å (Teff = 100, 105, and 110 kK, from top to bottom). Blue graphs show spectra computed without Ni lines, that is to say, we only see the Fe VIII line profile. The nickel lines become weaker and the iron line becomes stronger. As a result, the line Fe+Ni blend stays almost constant. The models have abundances of Fe = 3.5 × 10⁻³ and Ni = 3.0 × 10⁻⁴ by mass.
Current usage metrics show cumulative count of Article Views (full-text article views including HTML views, PDF and ePub downloads, according to the available data) and Abstracts Views on Vision4Press platform.
Data correspond to usage on the plateform after 2015. The current usage metrics is available 48-96 hours after online publication and is updated daily on week days.
Initial download of the metrics may take a while.