Fig. 2
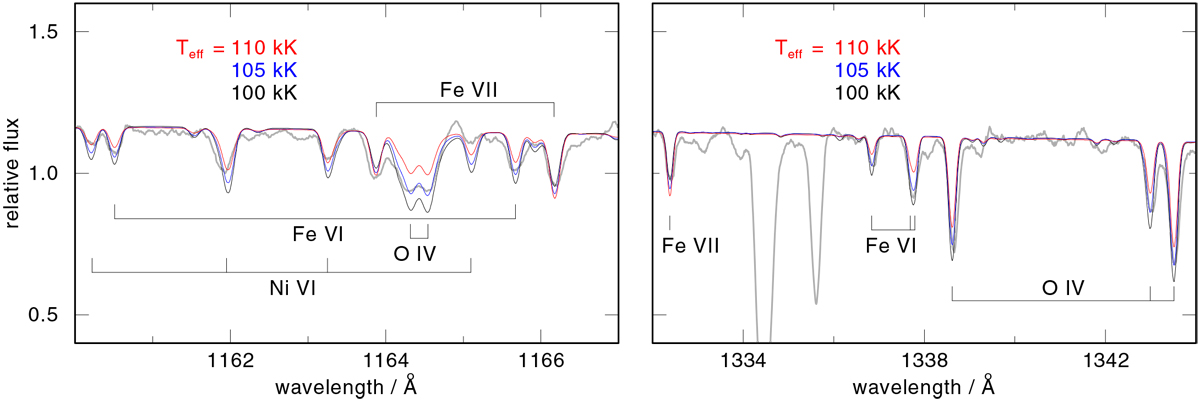
Details of observed WD spectrum compared with three models with different temperatures (Teff = 105 000 ± 5000 K) representing the error range in determination of Teff. Left: O IV multiplet gets weaker with increasing Teff, as well as lines from Fe VI and Ni VI, while Fe VII lines get stronger. Right: same behavior of oxygen and iron lines in another wavelength range.
Current usage metrics show cumulative count of Article Views (full-text article views including HTML views, PDF and ePub downloads, according to the available data) and Abstracts Views on Vision4Press platform.
Data correspond to usage on the plateform after 2015. The current usage metrics is available 48-96 hours after online publication and is updated daily on week days.
Initial download of the metrics may take a while.