Fig. 1
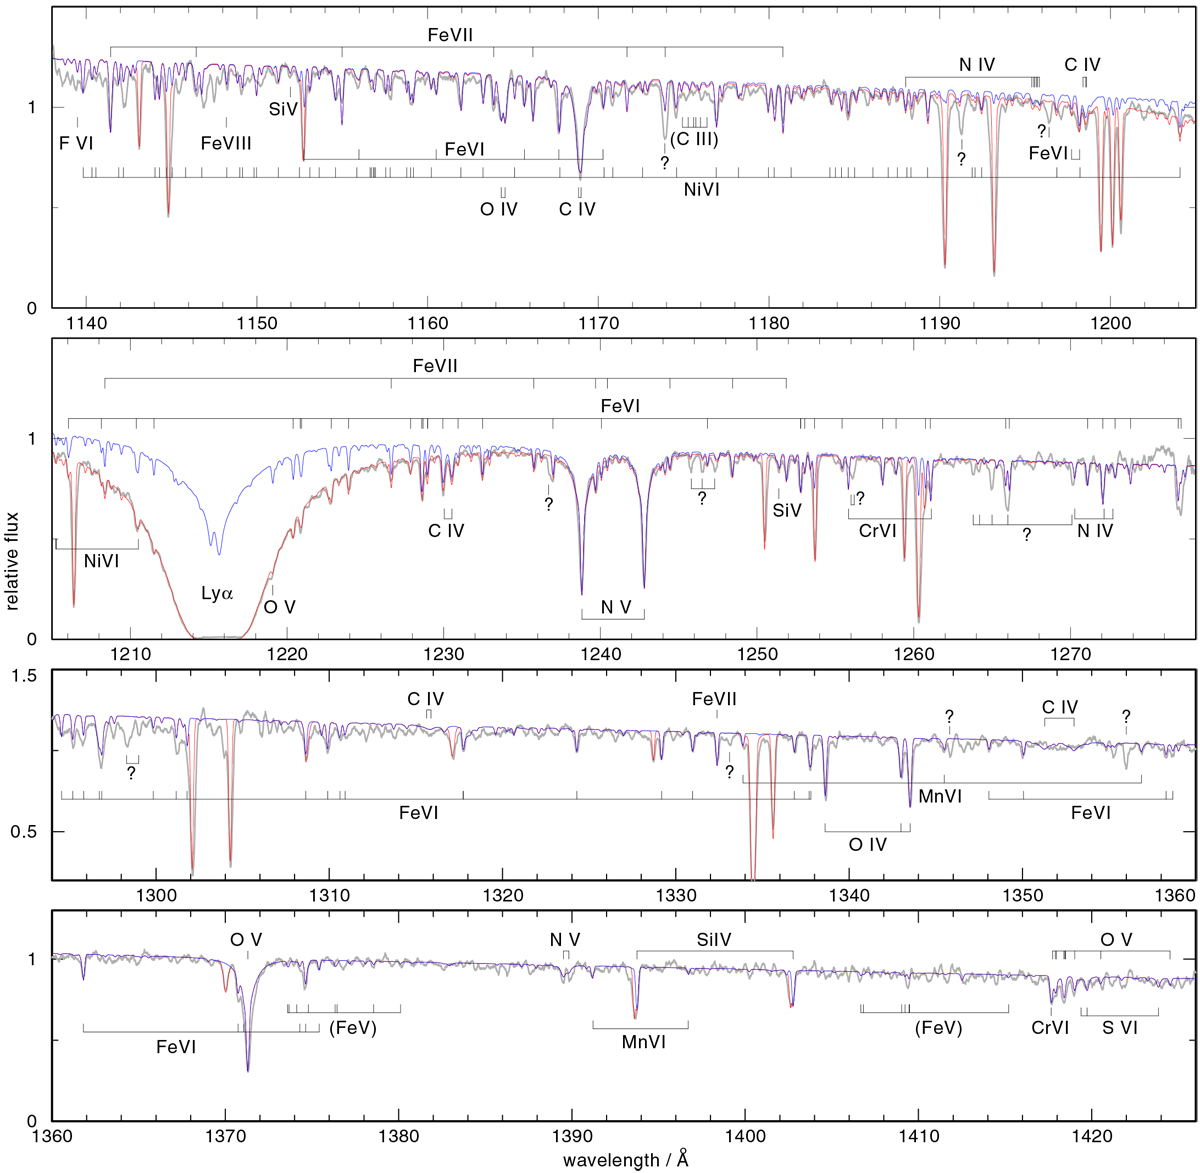
HST/COS spectrum of the white dwarf in UCAC2 46706450 (gray) compared to a photospheric model spectrum (blue graph: Teff = 105 000 K, log g = 7.4) with the measured metal abundances (Table 1) and assuming solar H and He abundances. The same model attenuated by interstellar lines is plotted in red. Prominent photospheric lines are identified. Identifications in brackets denote uncertain detections. Question marks indicate unidentified photospheric lines.
Current usage metrics show cumulative count of Article Views (full-text article views including HTML views, PDF and ePub downloads, according to the available data) and Abstracts Views on Vision4Press platform.
Data correspond to usage on the plateform after 2015. The current usage metrics is available 48-96 hours after online publication and is updated daily on week days.
Initial download of the metrics may take a while.