Open Access
Fig. 9.
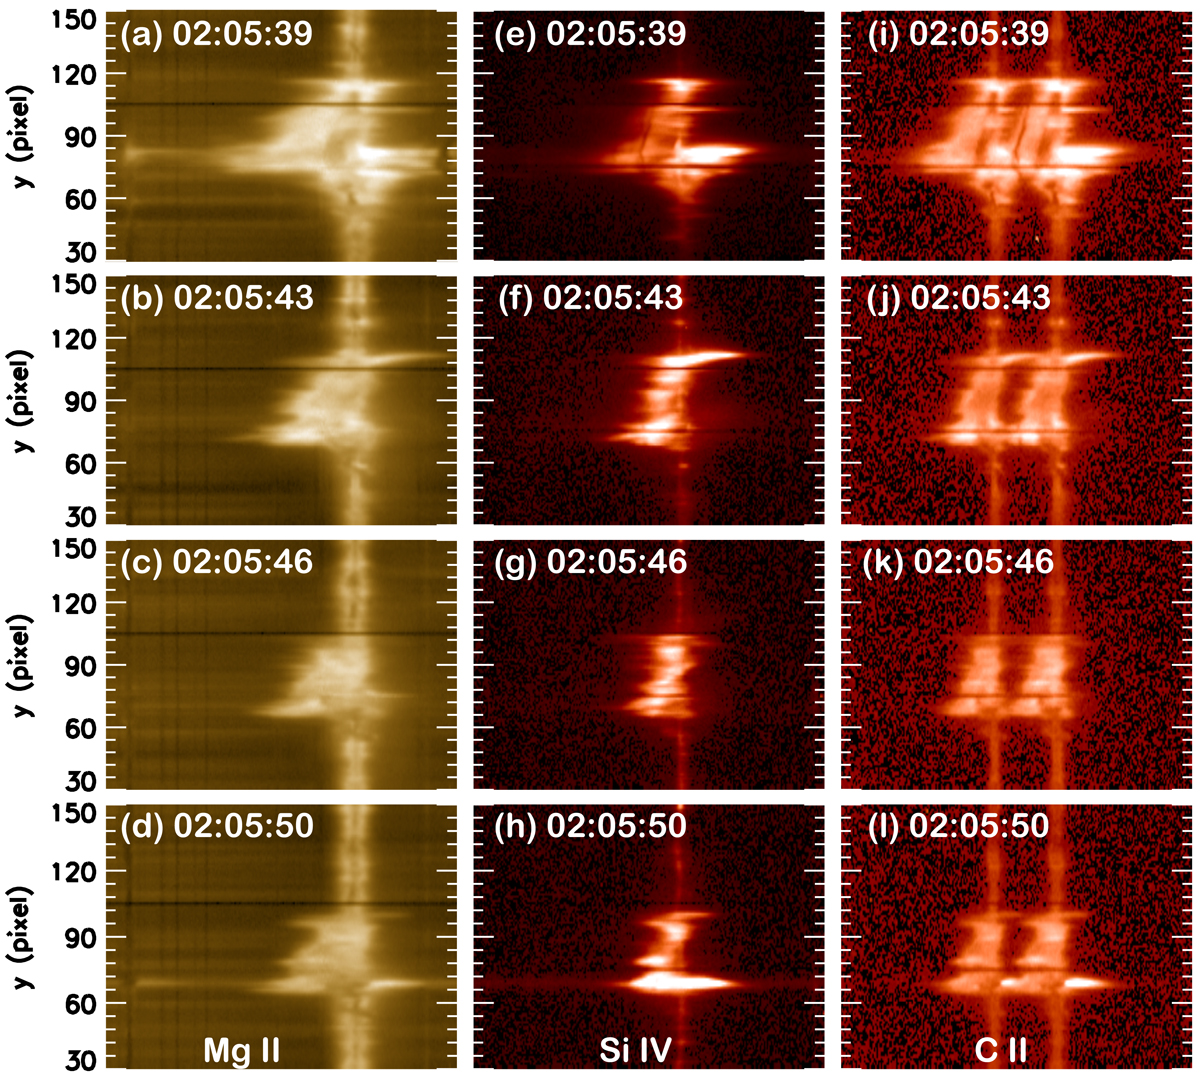
Tilt observed in the three lines Mg II (left column), C II (middle column), and Si IV (right column) observed with IRIS instrument. The four different rows are showing the spectras at the four different slit positions from east to west: 1, 2, 3, and 4.
Current usage metrics show cumulative count of Article Views (full-text article views including HTML views, PDF and ePub downloads, according to the available data) and Abstracts Views on Vision4Press platform.
Data correspond to usage on the plateform after 2015. The current usage metrics is available 48-96 hours after online publication and is updated daily on week days.
Initial download of the metrics may take a while.