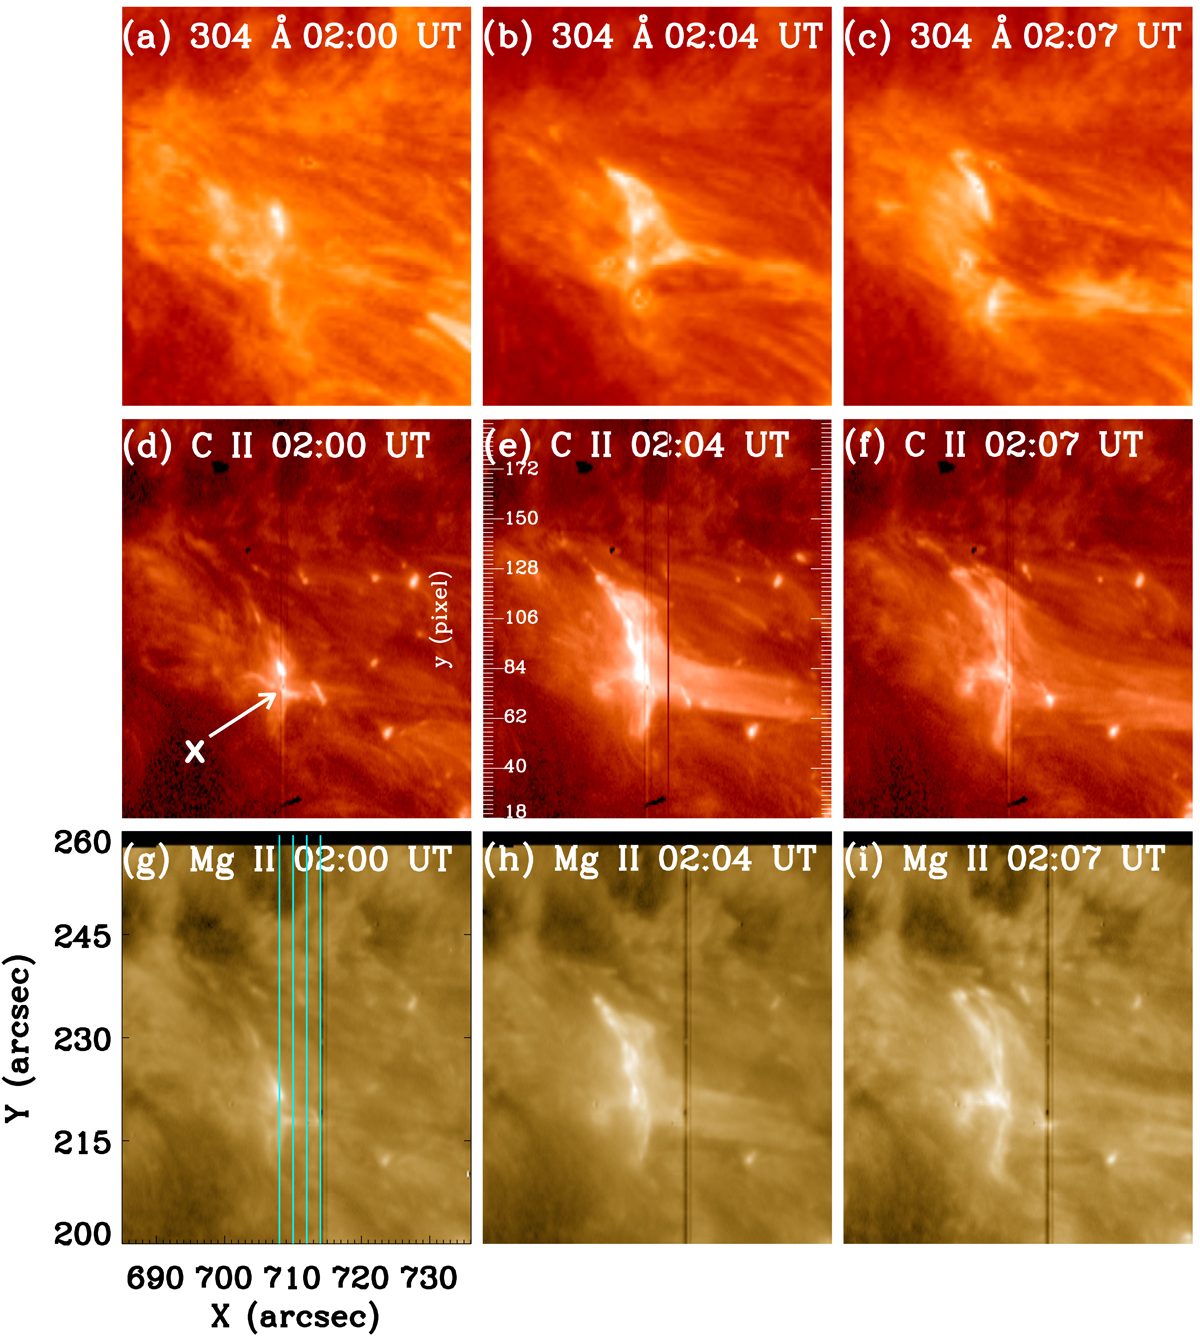
Fig. 7.

Solar jet observed in co-aligned images of EUV AIA 304 Å (top), of IRIS C II SJI (middle), and of IRIS Mg II SJI (bottom). The four positions of the slit in the raster mode are shown with vertical cyan lines in panel g. The dark vertical line in each panel d–i is the footprint of one position of the slit during the SJI shooting. In IRIS CII SJI images (middle row), the reconnection point is indicated as “X” in panel d and the original observed pixel values along the y axis are displayed in panel e. The FOV of these panels is indicated in Fig. 3a. In this figure we keep the nominal coordinates of IRIS which are translated by +4 arcsec in x and +3 in y compared to the AIA coordinates.
Current usage metrics show cumulative count of Article Views (full-text article views including HTML views, PDF and ePub downloads, according to the available data) and Abstracts Views on Vision4Press platform.
Data correspond to usage on the plateform after 2015. The current usage metrics is available 48-96 hours after online publication and is updated daily on week days.
Initial download of the metrics may take a while.


