Fig. 6.
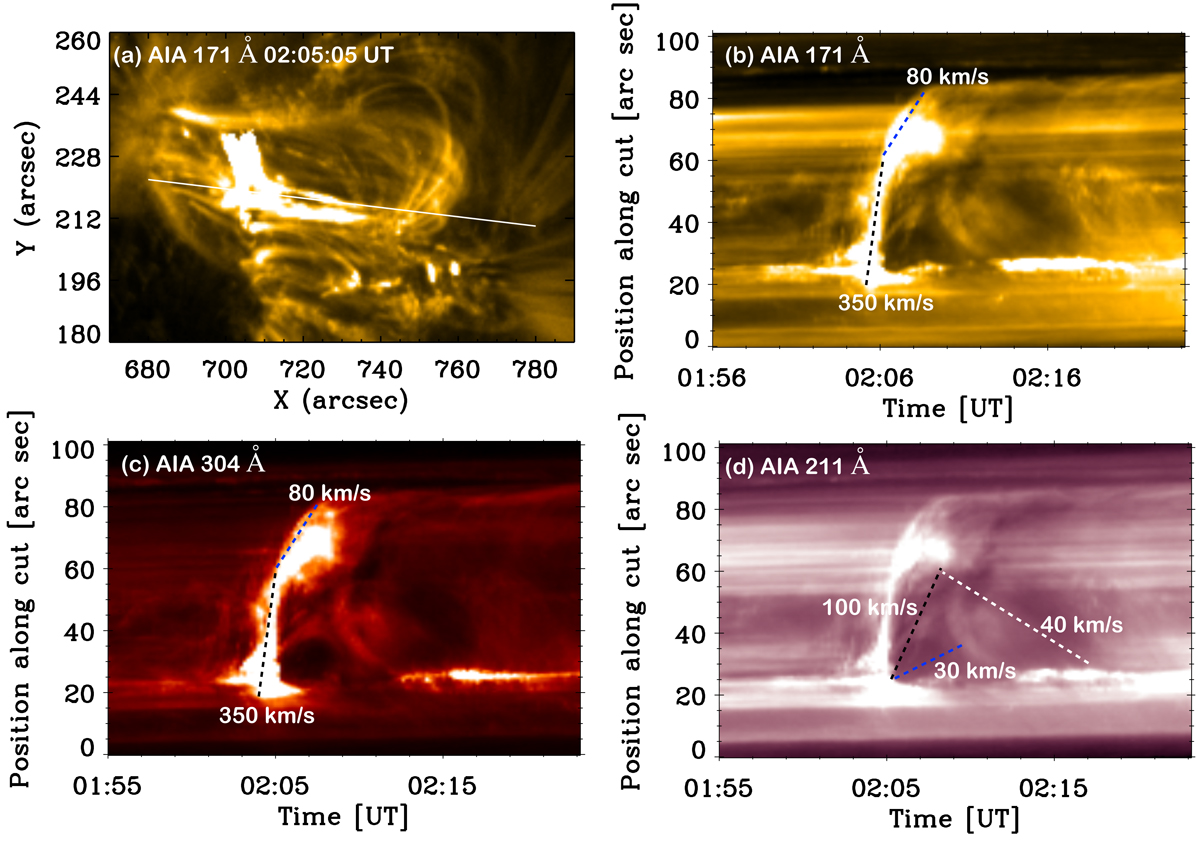
Height-time profile for the jet in different AIA wavelengths (b-d). The location of the slit (width = 8 pixels) along the plasma flow direction, which is used to generate the height-time plot, is shown as the white solid line in panel a. The jet and surge both showed a two phase eruption, i.e. fast and slow. The jet is erupted with a high speed of ≈350 km s−1 and after that it is slowed down to ≈80 km s−1 (panels b–c). The surge is erupted with a maximum speed of ≈100 km s−1 and the dense material came back to the source region with a speed of ≈40 km s−1 (panel d).
Current usage metrics show cumulative count of Article Views (full-text article views including HTML views, PDF and ePub downloads, according to the available data) and Abstracts Views on Vision4Press platform.
Data correspond to usage on the plateform after 2015. The current usage metrics is available 48-96 hours after online publication and is updated daily on week days.
Initial download of the metrics may take a while.