Fig. 5.
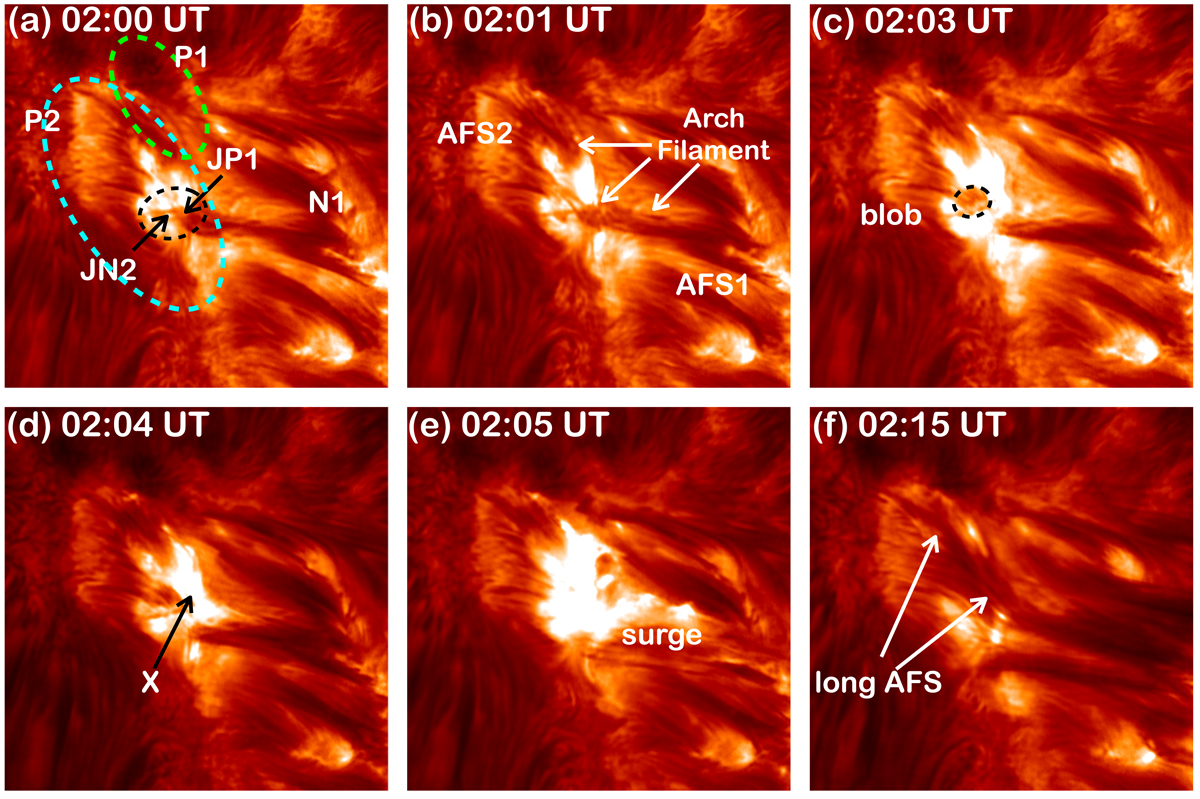
Hα line center observations of the AR NOAA 12736 with the NVST telescope for four times before (a-d) and one after (f) the surge extension. In panel a, the cyan oval encircles the emerging flux EMF2 like in Fig. 1 which corresponds to a dome (see Sect. 3.2.1), the green circle indicates the bipole P1-N2, the black circle the bipole JP1-JN2. In panel b, we highlight the two systems of AFS (AFS1 and AFS2), with the white arrows indicating long AFS overlying both AFS1 and AFS2 structures. In panel c, we see a dark blob in the middle of the brightening. In panel d the “X” point is indicated where the reconnection occurs. In panel e, the white, more or less horizontal material represents the beginning of the surge ejection with some knots. In panel f, we again see the long AFS. We have accurately rotated the data provided by the NVST team to make them comparable with the AIA and IRIS observations. The image size is 65″ × 65″.
Current usage metrics show cumulative count of Article Views (full-text article views including HTML views, PDF and ePub downloads, according to the available data) and Abstracts Views on Vision4Press platform.
Data correspond to usage on the plateform after 2015. The current usage metrics is available 48-96 hours after online publication and is updated daily on week days.
Initial download of the metrics may take a while.