Fig. 3.
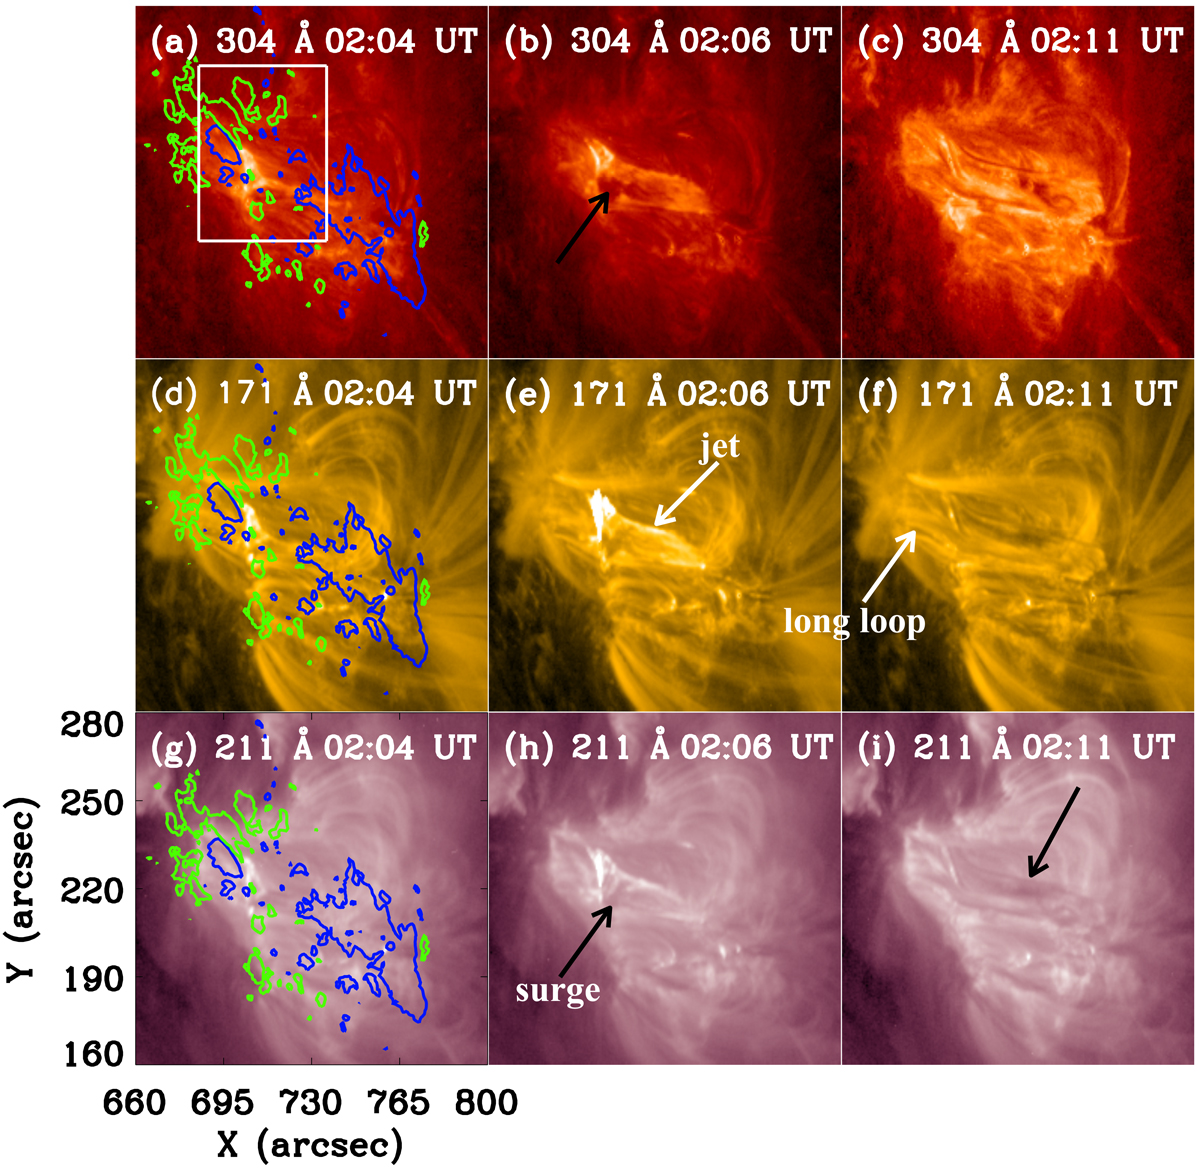
Solar jet and surge observed in different AIA/EUV channels (304 Å, 171 Å, and 211 Å) on March 22 2019 between 02:04 UT and 02:11 UT in NOAA AR 12736. The black arrows in (b) and (h) indicate a dark area corresponding to a surge, the white arrow points the jet in (e) and a long loop created after the reconnection in (f), the black arrow in (i) an AFS. In the first column the images are overlaid with HMI longitudinal magnetic field contours (±300 Gauss) for positive and negative magnetic polarities with green and blue colours, respectively. The white box in panel a indicates the FOV of Fig. 7. The small bipole center is at 710″, 220″, and the major bipole center is at 695″, 230″.
Current usage metrics show cumulative count of Article Views (full-text article views including HTML views, PDF and ePub downloads, according to the available data) and Abstracts Views on Vision4Press platform.
Data correspond to usage on the plateform after 2015. The current usage metrics is available 48-96 hours after online publication and is updated daily on week days.
Initial download of the metrics may take a while.