Fig. 12.
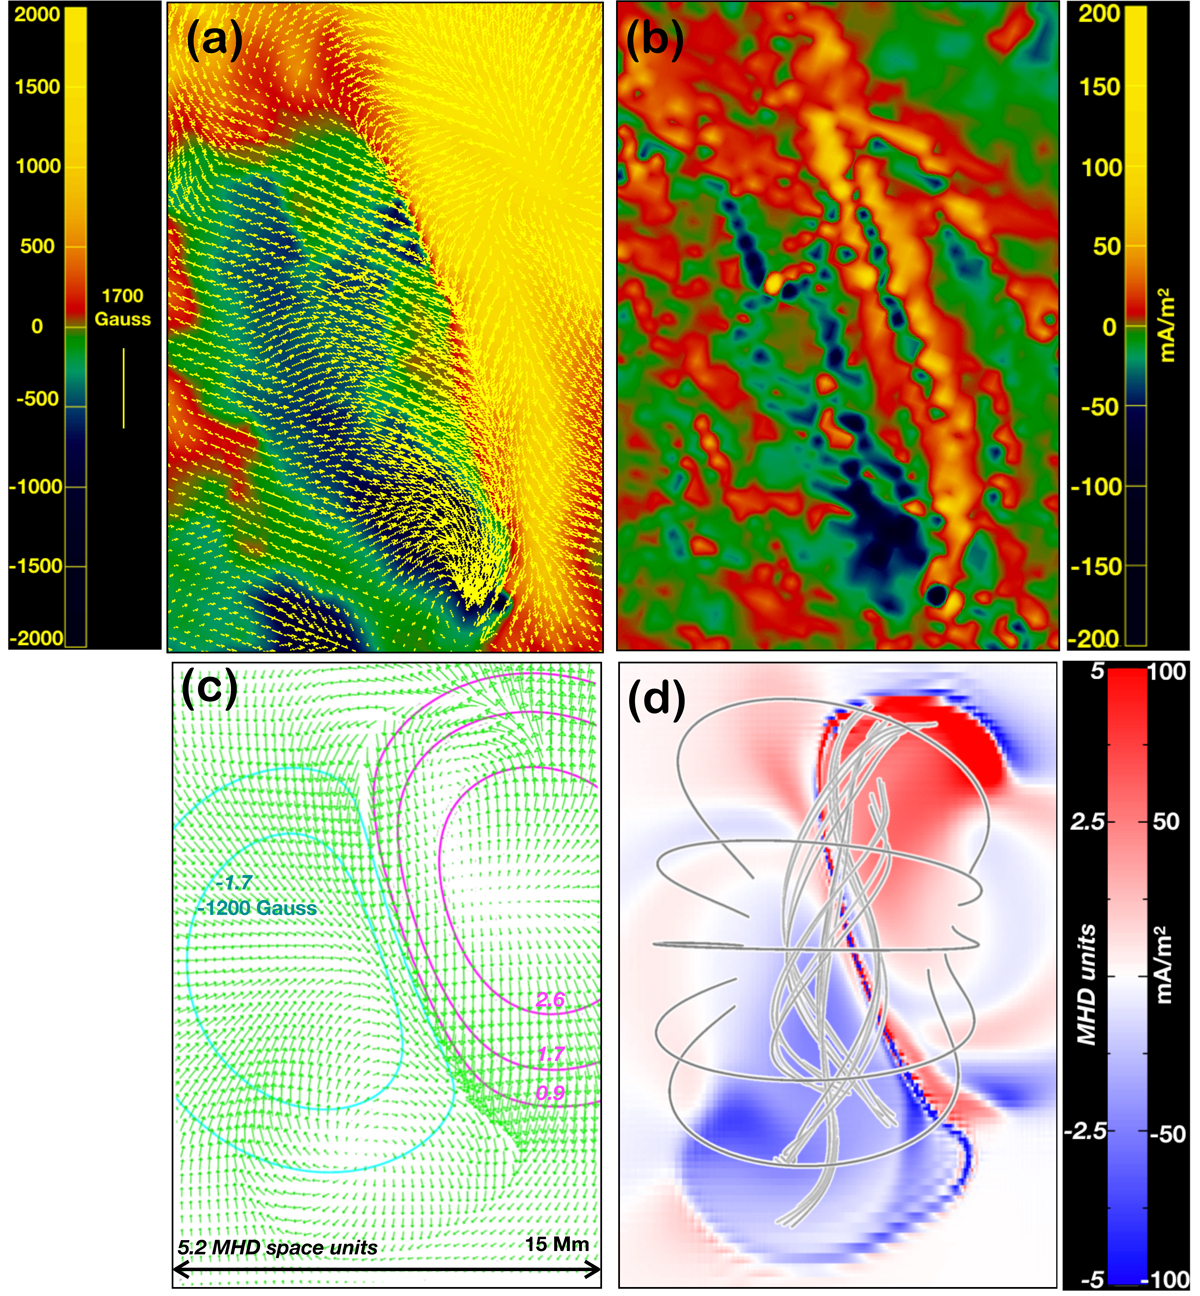
Flux rope (FR) evidenced in the HMI observations (a, b) and comparison with the images from MHD simulations (c, d). Panel a: vector magnetic field map computed with the UNNOFIT code and the yellow (dark) blue areas show the positive (negative) magnetic field polarity. Panel b: current density map computed with UNNOFIT code. The FOV for panels a-b is presented in Fig. 11a and to compare with MHD simulation we rotated the observations 30° clockwise. Panel c: from MHD simulations the iso-contours of vertical magnetic field with vectors. The pattern of the green vectors is same as with the yellow vectors in observations in panel a. Panel d: the magnetic field lines are plotted with the grey colour and the red and blue contours are electric currents. So the FR has a very strong electric currents, with the current flowing from red to blue. The vector pattern of observations and model looks the same, as they are strongly nearly parallel to the PIL and converging together in the bottom part. The convergence is due to the asymmetry of the magnetic configuration. The colour bar (top left) indicates the vertical magnetic field strength in Gauss for panel a, the colour bar (top right) the strength of electric current in mA m−2 for panel b, the colour bars (bottom right) represent the strength of the electric current in MHD units (left colour bar), and in physical units (right colour bar) for panel d.
Current usage metrics show cumulative count of Article Views (full-text article views including HTML views, PDF and ePub downloads, according to the available data) and Abstracts Views on Vision4Press platform.
Data correspond to usage on the plateform after 2015. The current usage metrics is available 48-96 hours after online publication and is updated daily on week days.
Initial download of the metrics may take a while.