Fig. 1.
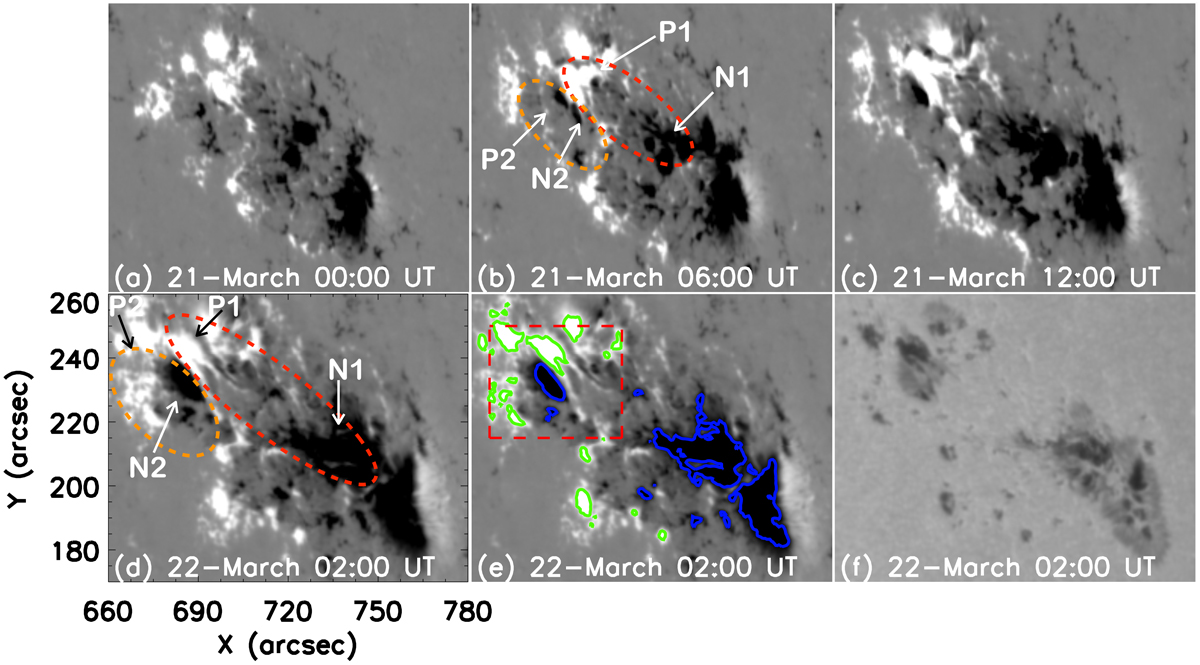
Panels a–e: HMI longitudinal magnetograms of AR NOAA 12736 showing the evolution of the magnetic polarities. The jet reconnection is occurring between the two large emerging flux areas EMF1 (P1, N1) and EMF2 (P2, N2) encompassed in the two ovals drawn in panels b and d. The emergence of the EMFs is shown by the extension of the two ovals between these two times. Panel f: HMI continuum image showing the sunspots and pores of the AR. The blue and green contours are for negative, and positive magnetic field polarities with label ±300 Gauss. The red rectangular box in panel e shows the FOV of Figs. 2a and 11a and b.
Current usage metrics show cumulative count of Article Views (full-text article views including HTML views, PDF and ePub downloads, according to the available data) and Abstracts Views on Vision4Press platform.
Data correspond to usage on the plateform after 2015. The current usage metrics is available 48-96 hours after online publication and is updated daily on week days.
Initial download of the metrics may take a while.