Fig. 9.
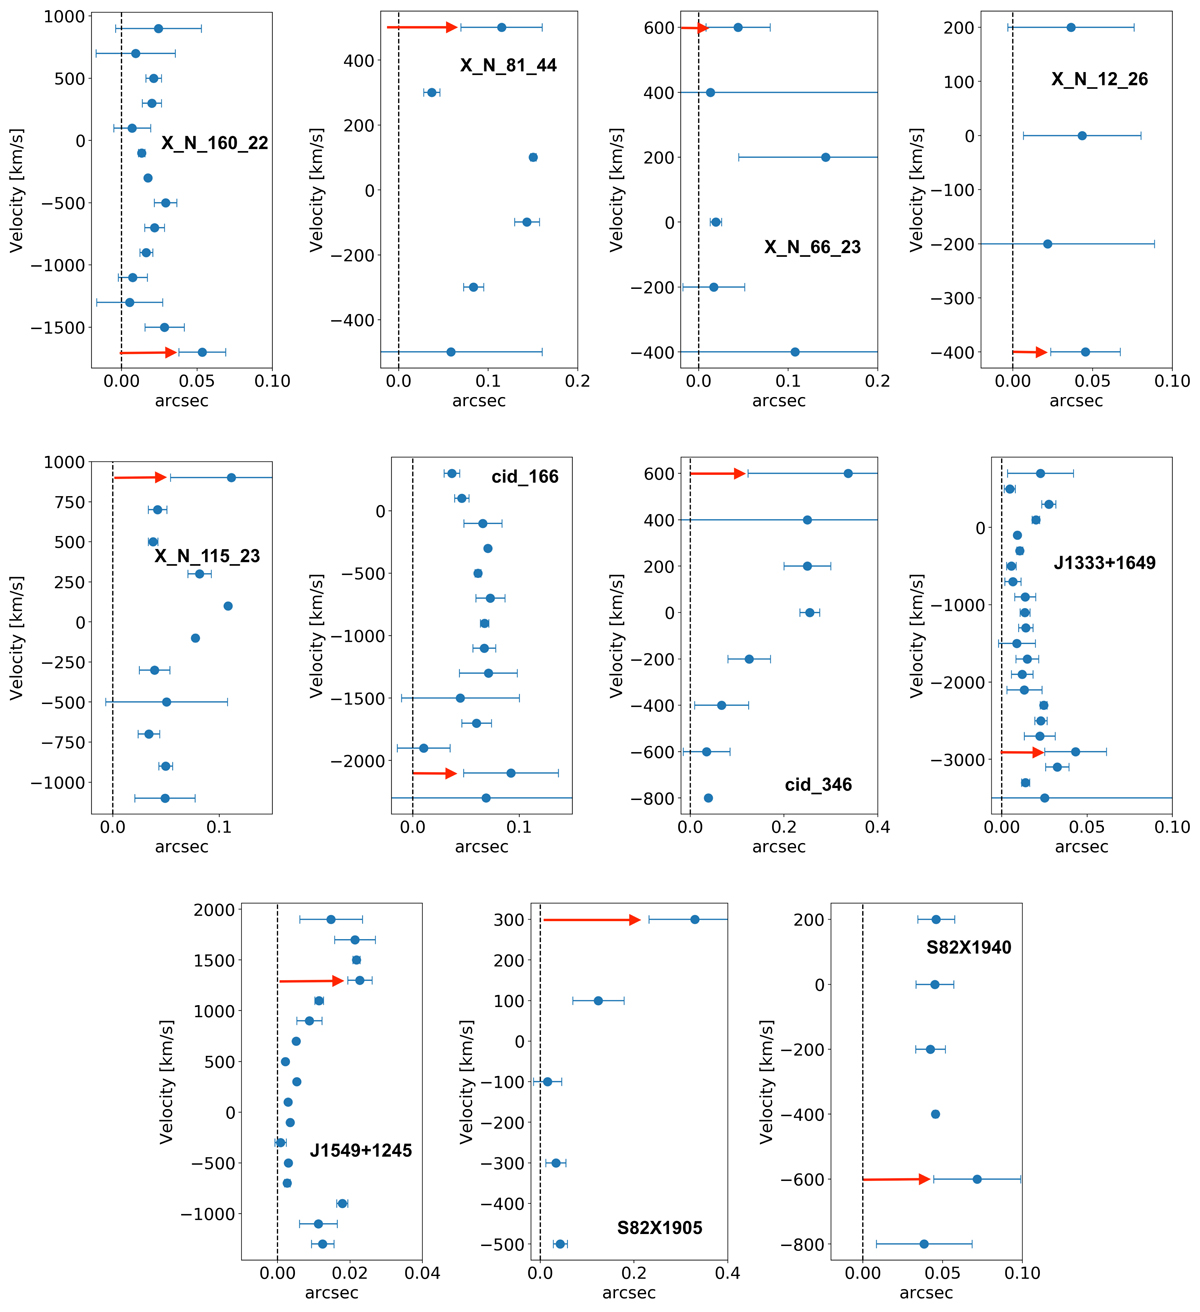
Results of spectroastrometry applied on the Type 1 SUPER targets. The X-axis represents the distance between the continuum centre (vertical dashed line) and the position of the photo-centre of the [O III] line at the corresponding velocity channel given in the Y-axis. The error bars represent 1σ uncertainty on the values. The red arrow marks the cloud with velocity greater than 600 km s−1 (300 km s−1 in the [O III] line profile) whose centroid is at the maximum distance from the AGN.
Current usage metrics show cumulative count of Article Views (full-text article views including HTML views, PDF and ePub downloads, according to the available data) and Abstracts Views on Vision4Press platform.
Data correspond to usage on the plateform after 2015. The current usage metrics is available 48-96 hours after online publication and is updated daily on week days.
Initial download of the metrics may take a while.