Fig. 6.
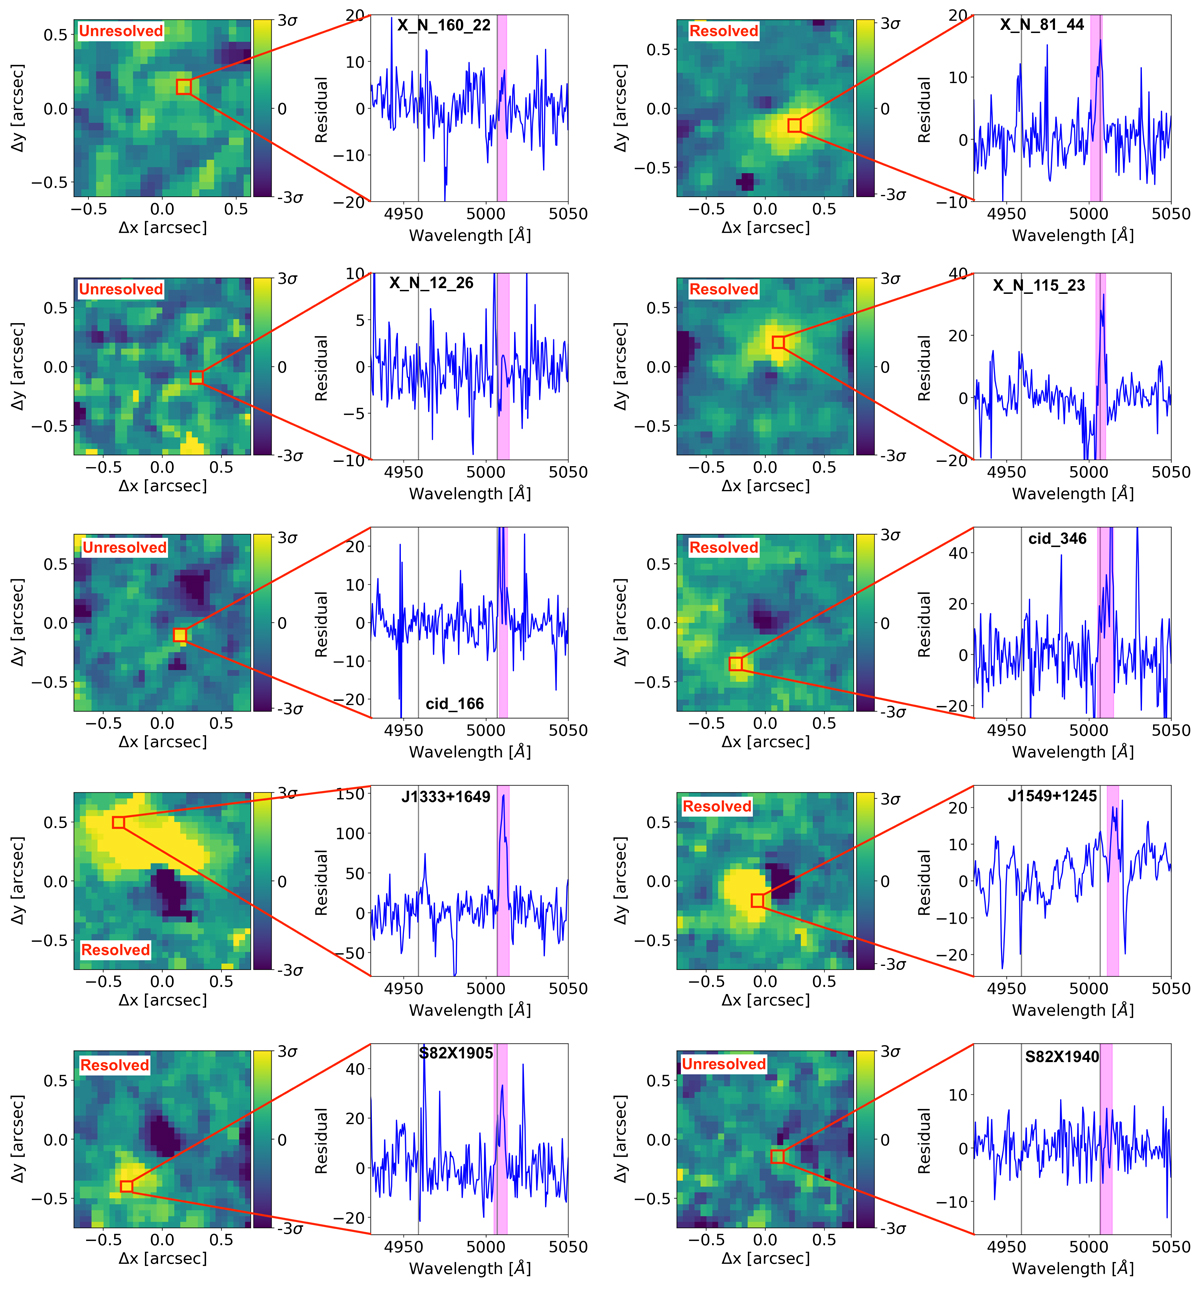
Residuals obtained using “PSF-subtraction” method across the SINFONI FoV as described in Sect. 5 for the Type 1 sample. Left panel: residual image obtained by collapsing the channels at the location of [O III] λ5007 after subtracting the emission from the AGN. The colour map is on a linear scale with the yellow regions showing excess emission (i.e. > 3σ). North is up and east is to left. Right panel: spectrum extracted at the location of excess emission, with an aperture of 0.1″ × 0.1″ shown by the red square in the left panel. The vertical grey lines in the residual spectrum shows the location of the [O III] λ4959 and [O III] λ5007, respectively, while the channels used to create the residual map on the left are indicated with a magenta box. Non-zero residuals in the images show that [O III] emission is resolved, while a noisy pattern is indicative of unresolved emission, which are, respectively, marked in the left panels. The AGN X_N_66_23 is not included in this analysis due to non-detection of the BLR component.
Current usage metrics show cumulative count of Article Views (full-text article views including HTML views, PDF and ePub downloads, according to the available data) and Abstracts Views on Vision4Press platform.
Data correspond to usage on the plateform after 2015. The current usage metrics is available 48-96 hours after online publication and is updated daily on week days.
Initial download of the metrics may take a while.