Fig. 5.
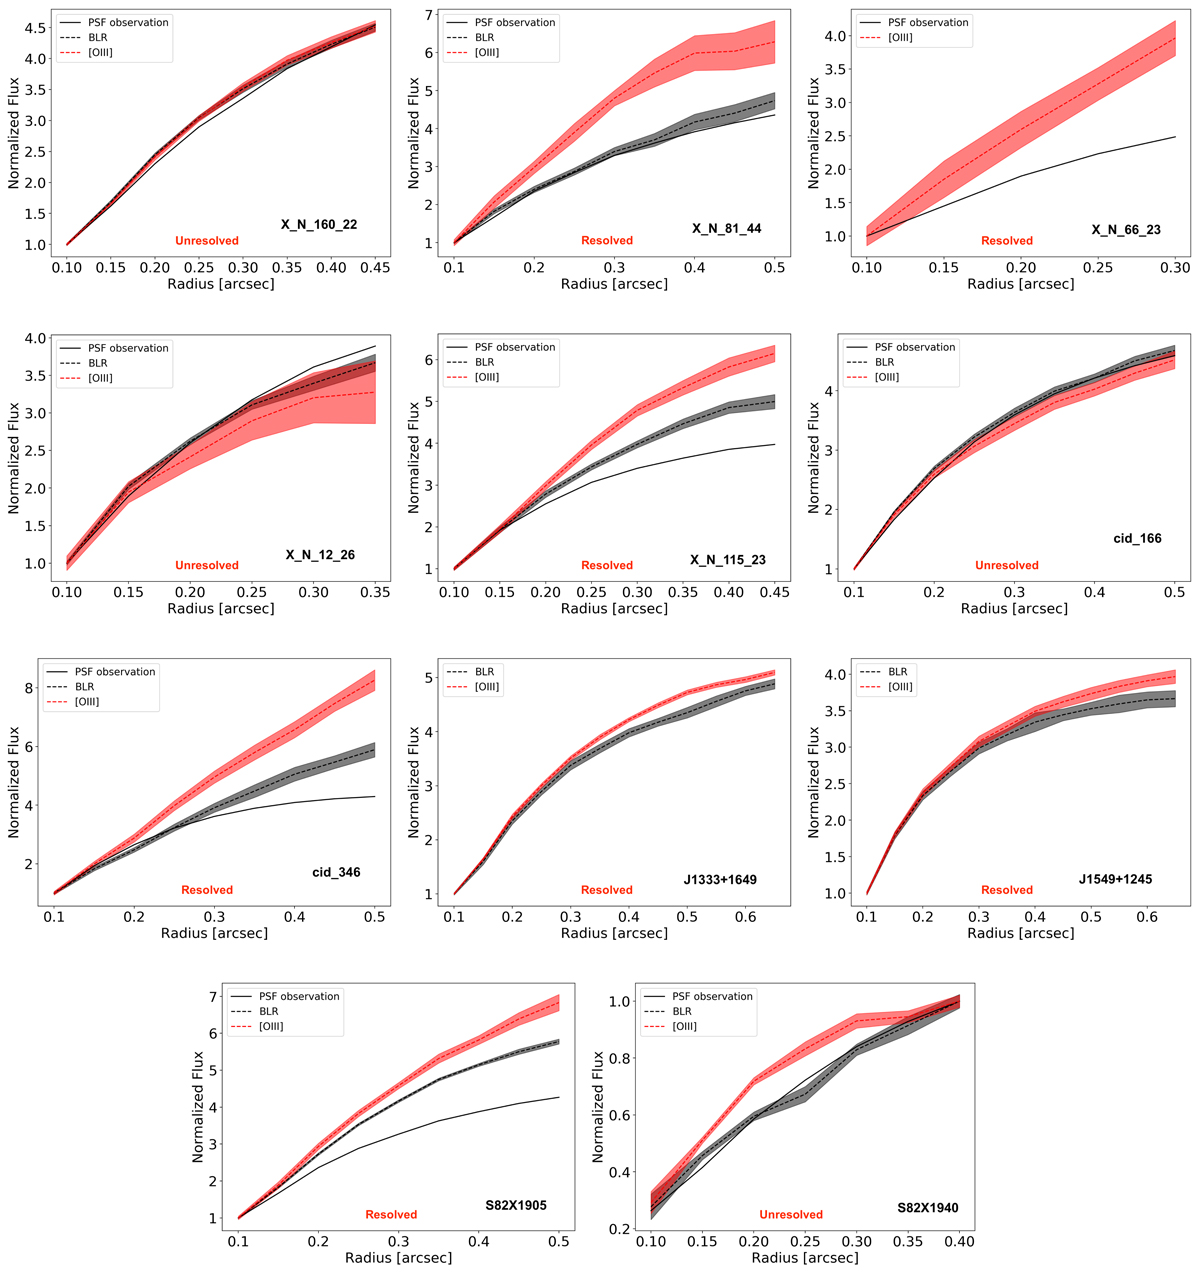
Curves of growth for the Type 1 sample as described in Sect. 5. The solid black line shows the curve from the image obtained by collapsing the PSF-observation cube at the location of [O III] λ5007 channels. The Hβ BLR component is shown as a dashed black curve with the grey area showing the 1σ uncertainly. The BLR component is unresolved and serves as a proxy to determine the PSF during the observations which is also compared with the dedicated PSF star observation. The red curve shows the curve of growth for the total [O III] emission, meaning narrow and broad components. All the uncertainties are at 1σ levels. The BLR component is not plotted for X_N_66_23 as it remains undetected. For the rest of the Type 1 sample in the SUPER survey, the S/N is not enough to perform such a curve-of-growth analysis.
Current usage metrics show cumulative count of Article Views (full-text article views including HTML views, PDF and ePub downloads, according to the available data) and Abstracts Views on Vision4Press platform.
Data correspond to usage on the plateform after 2015. The current usage metrics is available 48-96 hours after online publication and is updated daily on week days.
Initial download of the metrics may take a while.