Fig. 4.
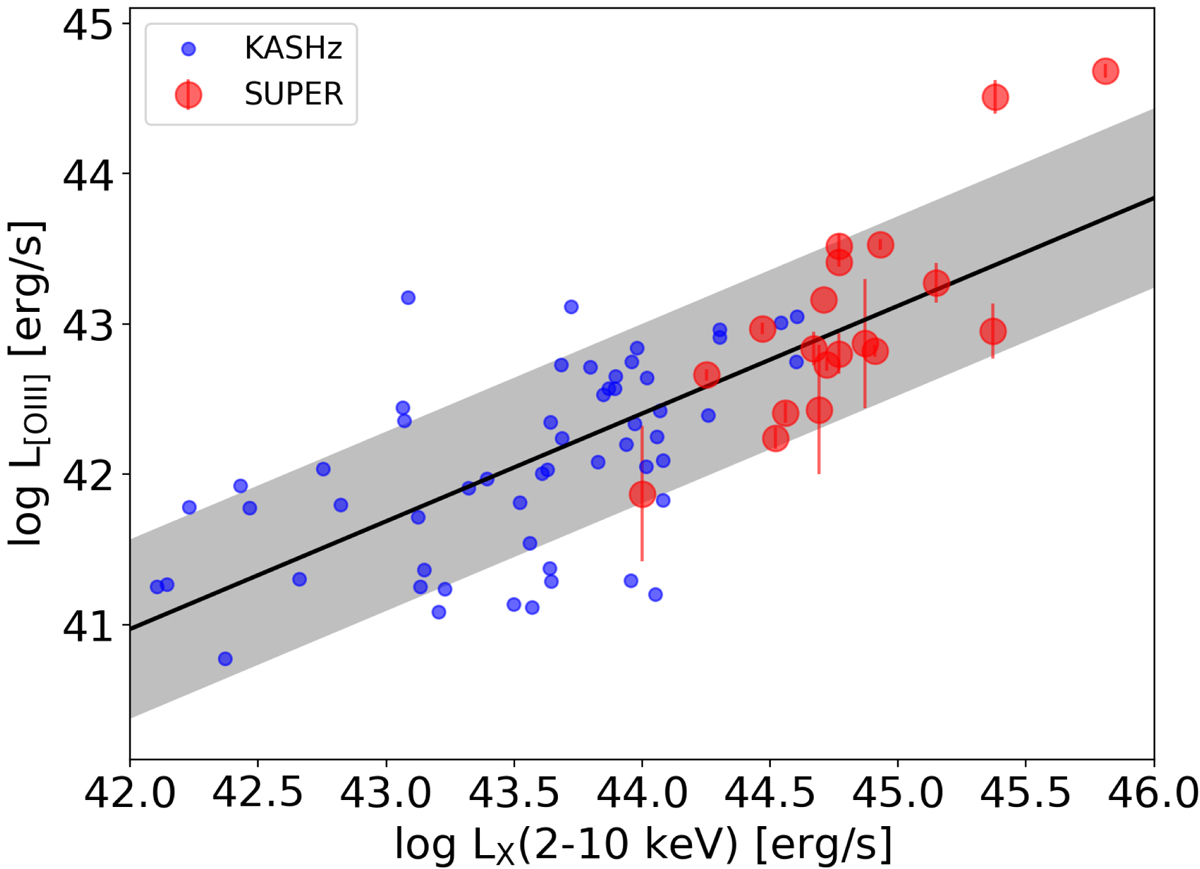
Total [O III] luminosity versus hard X-ray luminosity (LX(2–10 keV) for the SUPER (red circles) and KASHz targets (blue data points), the latter from a similar survey targeting X-ray selected AGN at high redshift. The combined data set of KASHz and SUPER show a positive correlation between the two quantities, shown by the black line. The shaded region represents the 1σ scatter on the relation. KASHz targets occupy the lower X-ray luminosity range compared to SUPER targets, which may explain the difference in the distribution of w80 in the two surveys in Fig. 3.
Current usage metrics show cumulative count of Article Views (full-text article views including HTML views, PDF and ePub downloads, according to the available data) and Abstracts Views on Vision4Press platform.
Data correspond to usage on the plateform after 2015. The current usage metrics is available 48-96 hours after online publication and is updated daily on week days.
Initial download of the metrics may take a while.