Fig. 3.
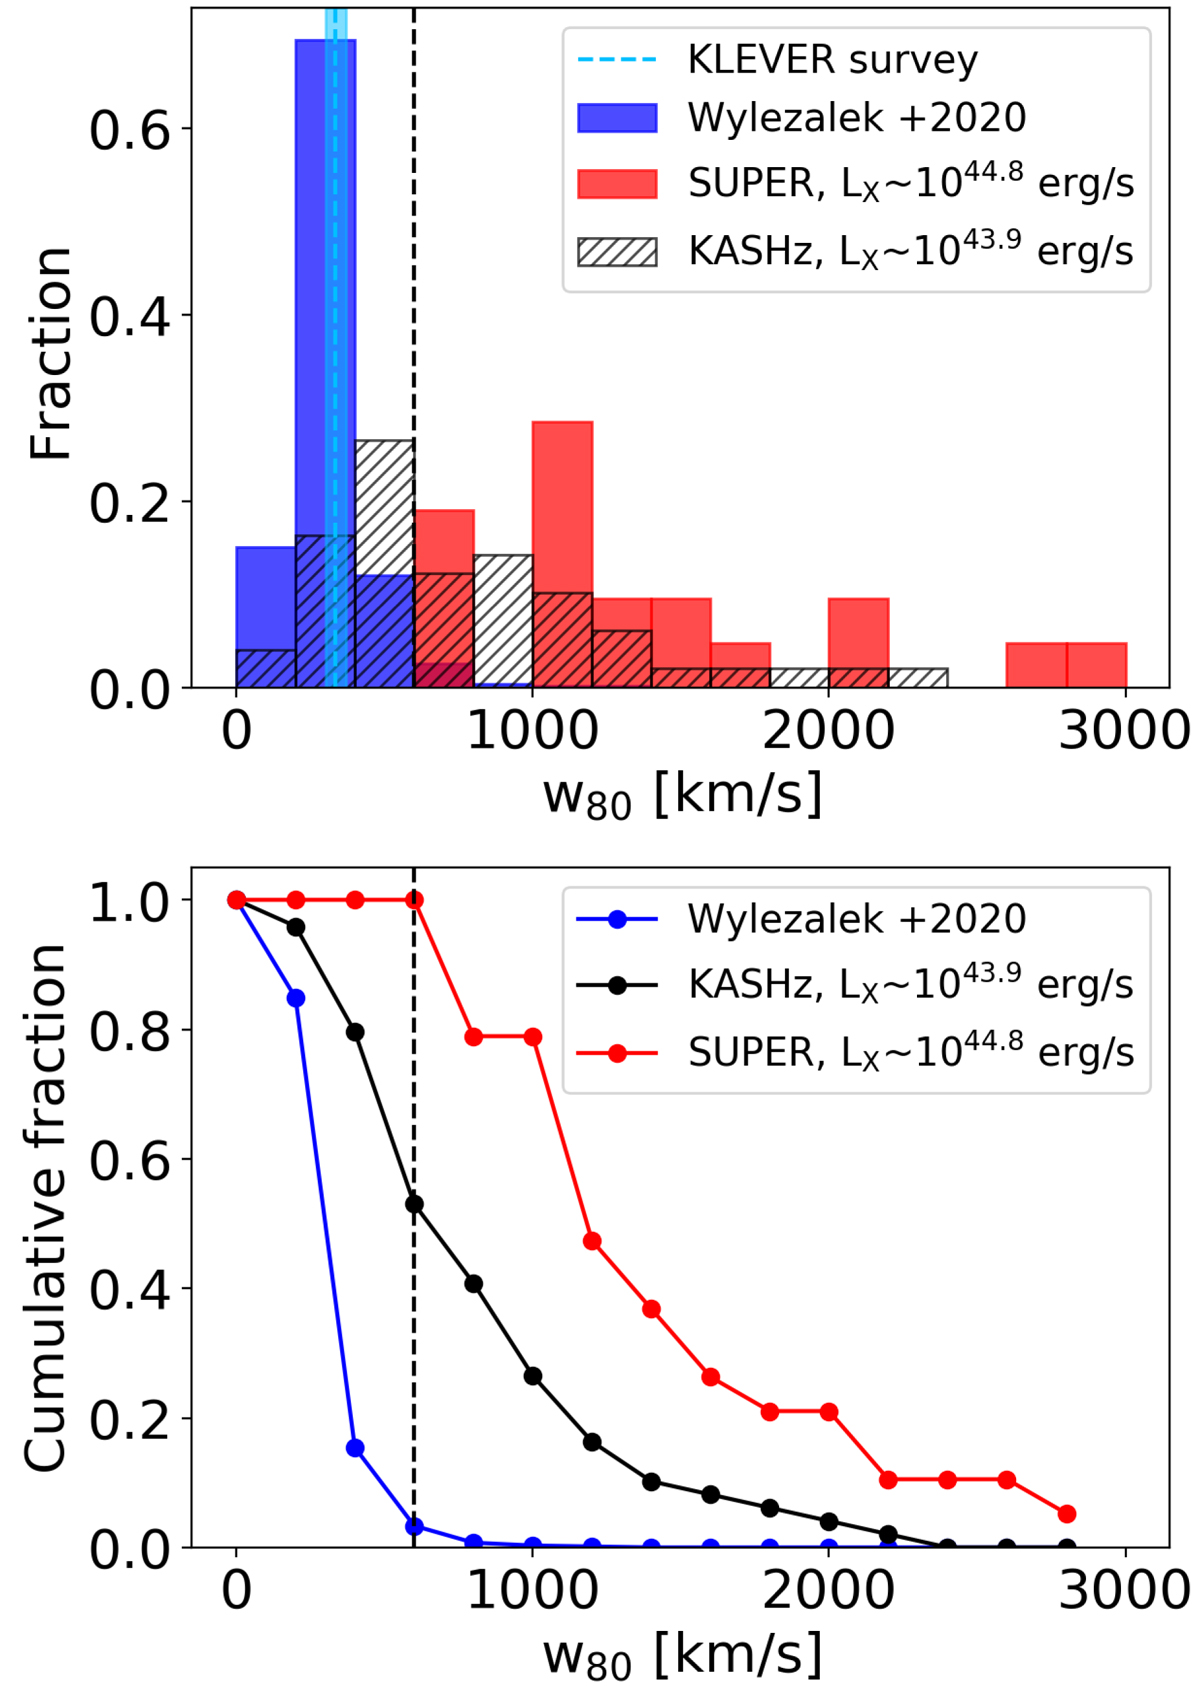
Top panel: distribution of the non-parametric velocity, w80 measured for [O III] λ5007 line, for AGN and star forming samples from different surveys. The AGN sample consists of targets from the SUPER survey in red (this paper) and targets from KASHz survey matched in redshift in hatched black (Harrison et al. 2016). The Type 1 sample used in this paper has a median hard X-ray luminosity of 1044.8 erg s−1 and the redshift-matched KASHz targets have a median X-ray luminosity of 1043.9 erg s−1. The blue histogram shows the w80 distribution of mass-matched low redshift star forming sample from Wylezalek et al. (2020), while the ocean-blue vertical bar shows the w80 value from the redshift and mass-matched star forming sample from the KLEVER survey (334 ± 35 km s−1, Curti et al. 2020). The dashed black-line at 600 km s−1 corresponds to the w80 value used in this work to define if a target hosts an AGN-driven outflow. Lower panel: inverse cumulative w80 distribution with the same colour coding as in the top panel. It is clear from both the panels that targets from the SUPER survey occupy the higher end of the w80 distribution. Based on the w80 criteria, all the targets in the SUPER survey show the presence of outflows, and ∼52% of the redshift matched targets in the KASHz survey show outflows.
Current usage metrics show cumulative count of Article Views (full-text article views including HTML views, PDF and ePub downloads, according to the available data) and Abstracts Views on Vision4Press platform.
Data correspond to usage on the plateform after 2015. The current usage metrics is available 48-96 hours after online publication and is updated daily on week days.
Initial download of the metrics may take a while.