Fig. A.5.
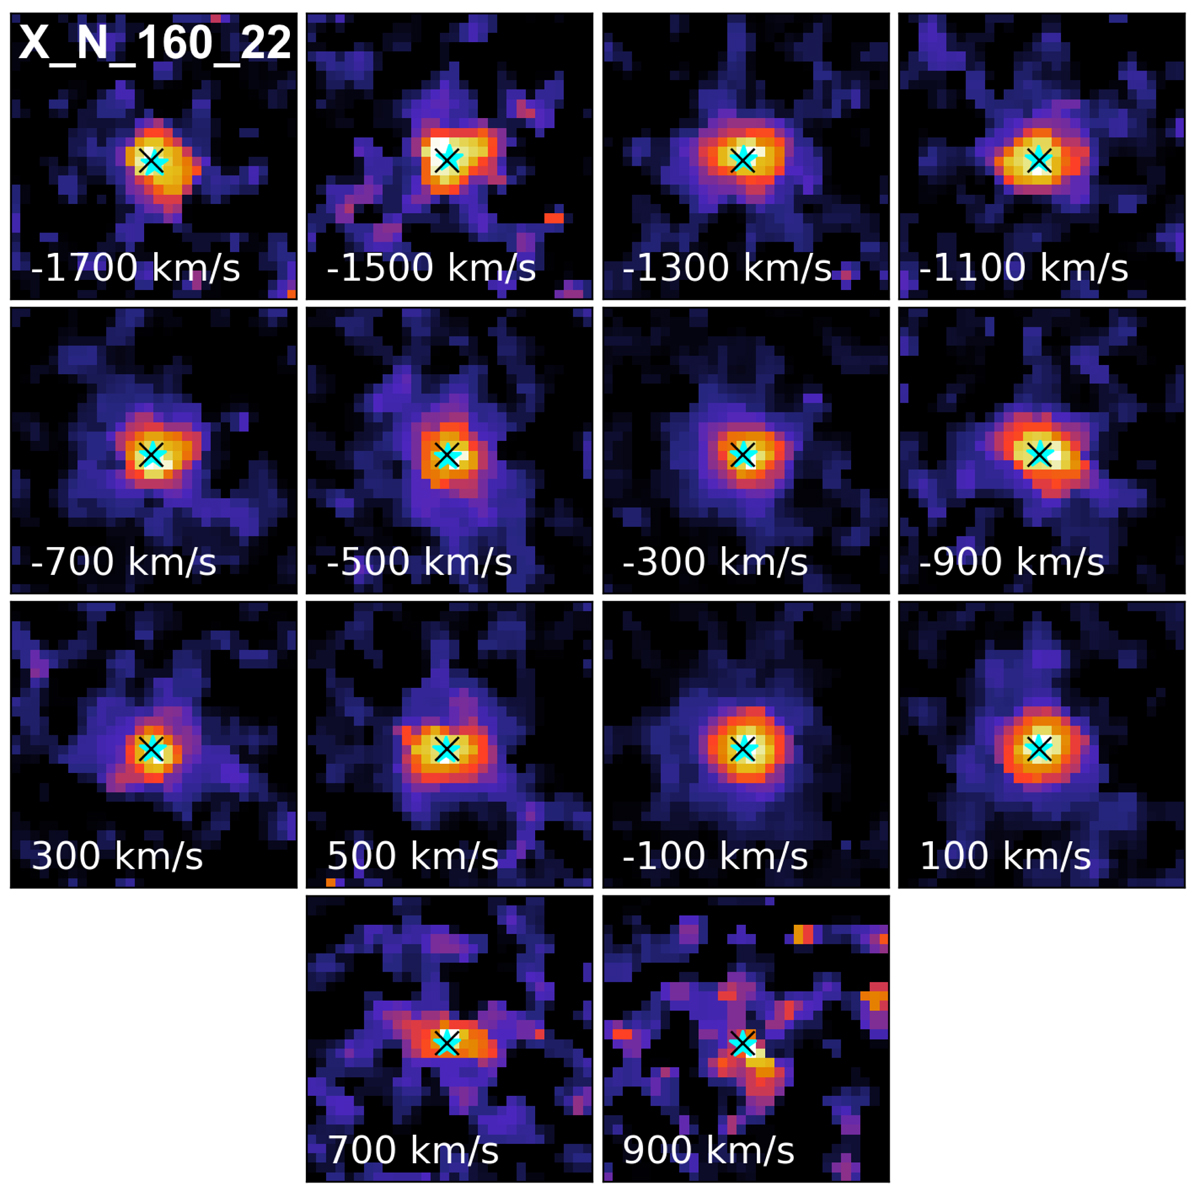
1.5″ × 1.5″ [O III] λ5007 channel maps of SUPER target X_N_160_22 at different velocity slices, after subtracting the Hβ, [O III] λ4959, and iron models from the raw cube. Each velocity slice is 200 km s−1 wide, and the displayed value is the centre velocity of the respective channel. The black cross marks the location of the H-band continuum peak, used as a proxy for the AGN position. North is up and east is left.
Current usage metrics show cumulative count of Article Views (full-text article views including HTML views, PDF and ePub downloads, according to the available data) and Abstracts Views on Vision4Press platform.
Data correspond to usage on the plateform after 2015. The current usage metrics is available 48-96 hours after online publication and is updated daily on week days.
Initial download of the metrics may take a while.