Fig. A.1.
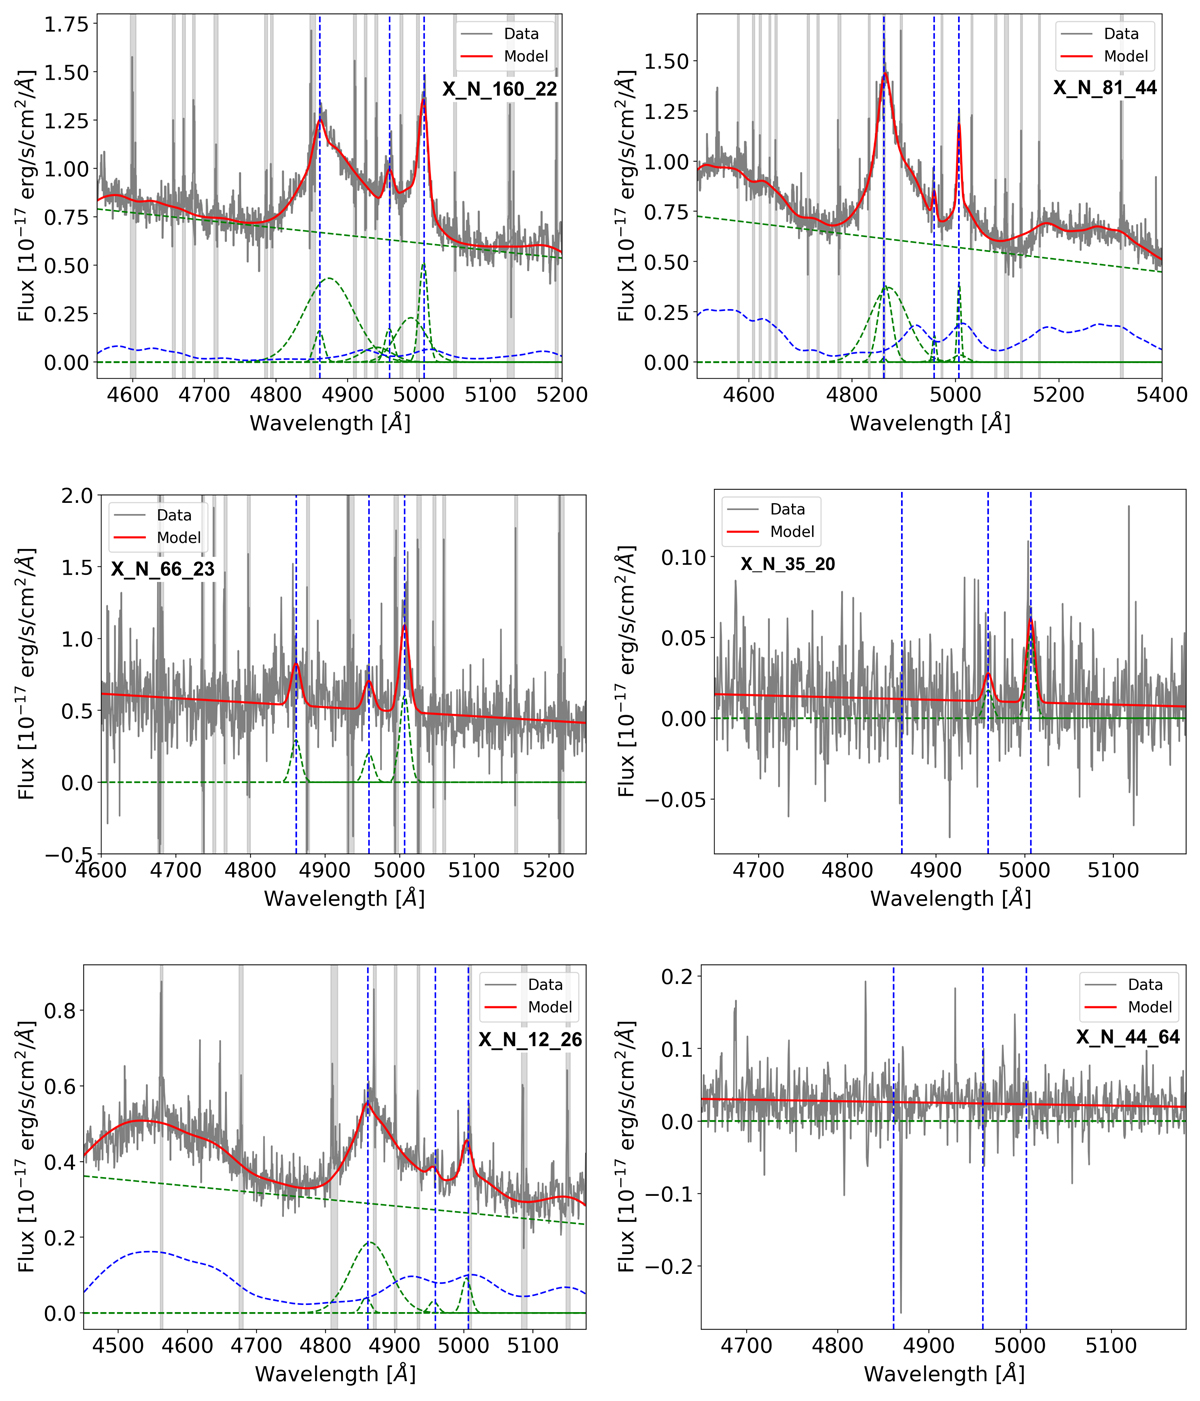
Integrated H-band spectrum of SUPER targets X_N_160_22, X_N_81_44, X_N_66_23, X_N_35_20, X_N_12_26, and X_N_44_64. The grey curve shows the observed spectrum, the red curve shows the reproduced overall emission line model, the blue dashed curve shows the iron emission, and the dashed green curves show the continuum emission and the individual Gaussian components (narrow, broad, and BLR) used to reproduce the profiles of various emission lines. The blue vertical lines indicate the locations of Hβ, [O III] λ4959, and [O III] λ5007. The vertical grey regions mark the channels with strong skylines, which were masked during the fitting procedure. The X-axis shows the rest frame wavelength after correcting for the redshift of the target and the Y-axis shows the observed flux.
Current usage metrics show cumulative count of Article Views (full-text article views including HTML views, PDF and ePub downloads, according to the available data) and Abstracts Views on Vision4Press platform.
Data correspond to usage on the plateform after 2015. The current usage metrics is available 48-96 hours after online publication and is updated daily on week days.
Initial download of the metrics may take a while.