Free Access
Fig. 14.
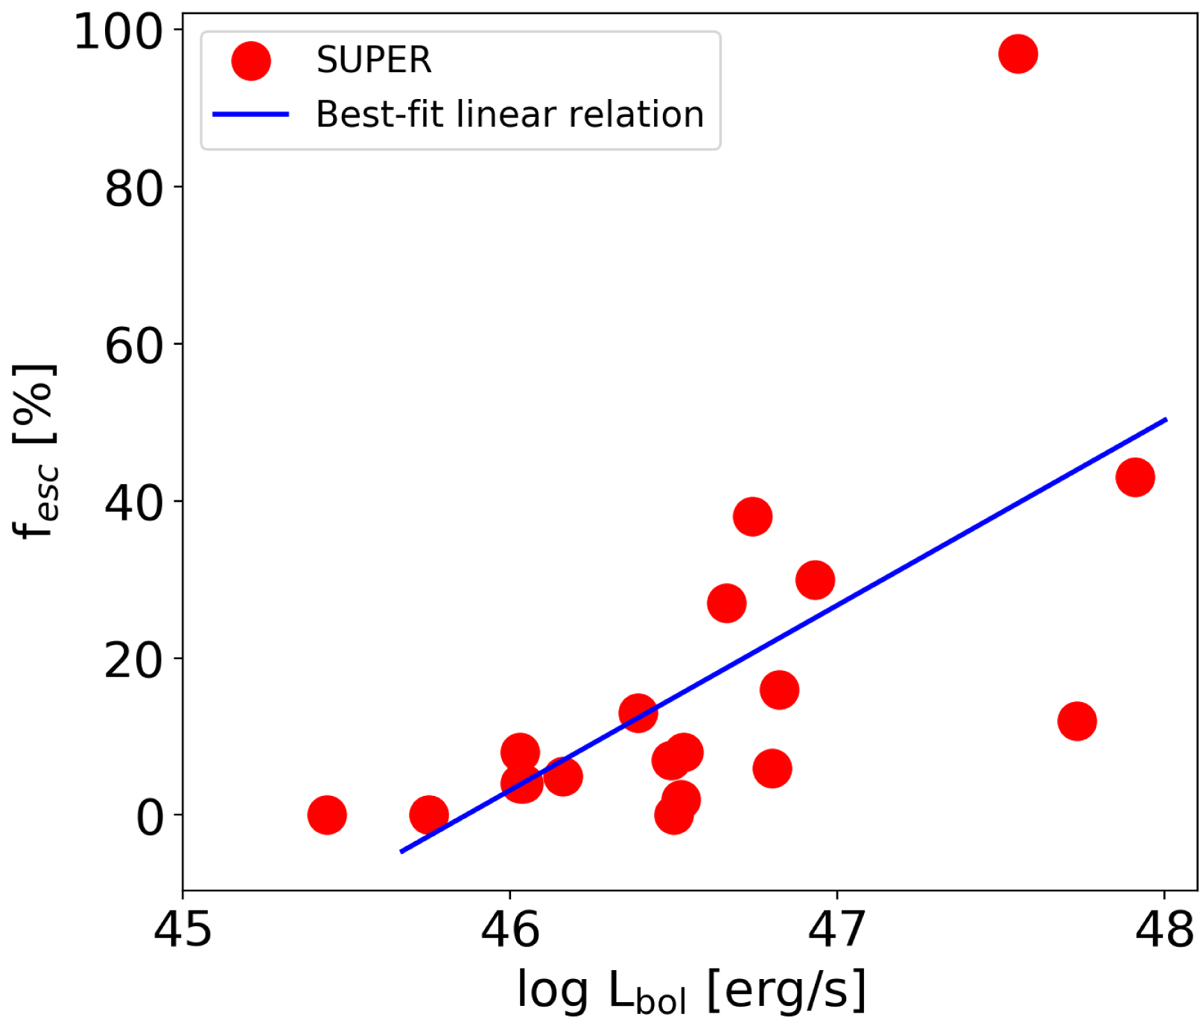
Escape fraction as a function of the bolometric luminosity of the AGN for the Type 1 sample presented in this paper. The escape velocity is calculated for a distance of 2 kpc from Eq. (5). The blue curve shows the best-fit relation.
Current usage metrics show cumulative count of Article Views (full-text article views including HTML views, PDF and ePub downloads, according to the available data) and Abstracts Views on Vision4Press platform.
Data correspond to usage on the plateform after 2015. The current usage metrics is available 48-96 hours after online publication and is updated daily on week days.
Initial download of the metrics may take a while.