Fig. 13.
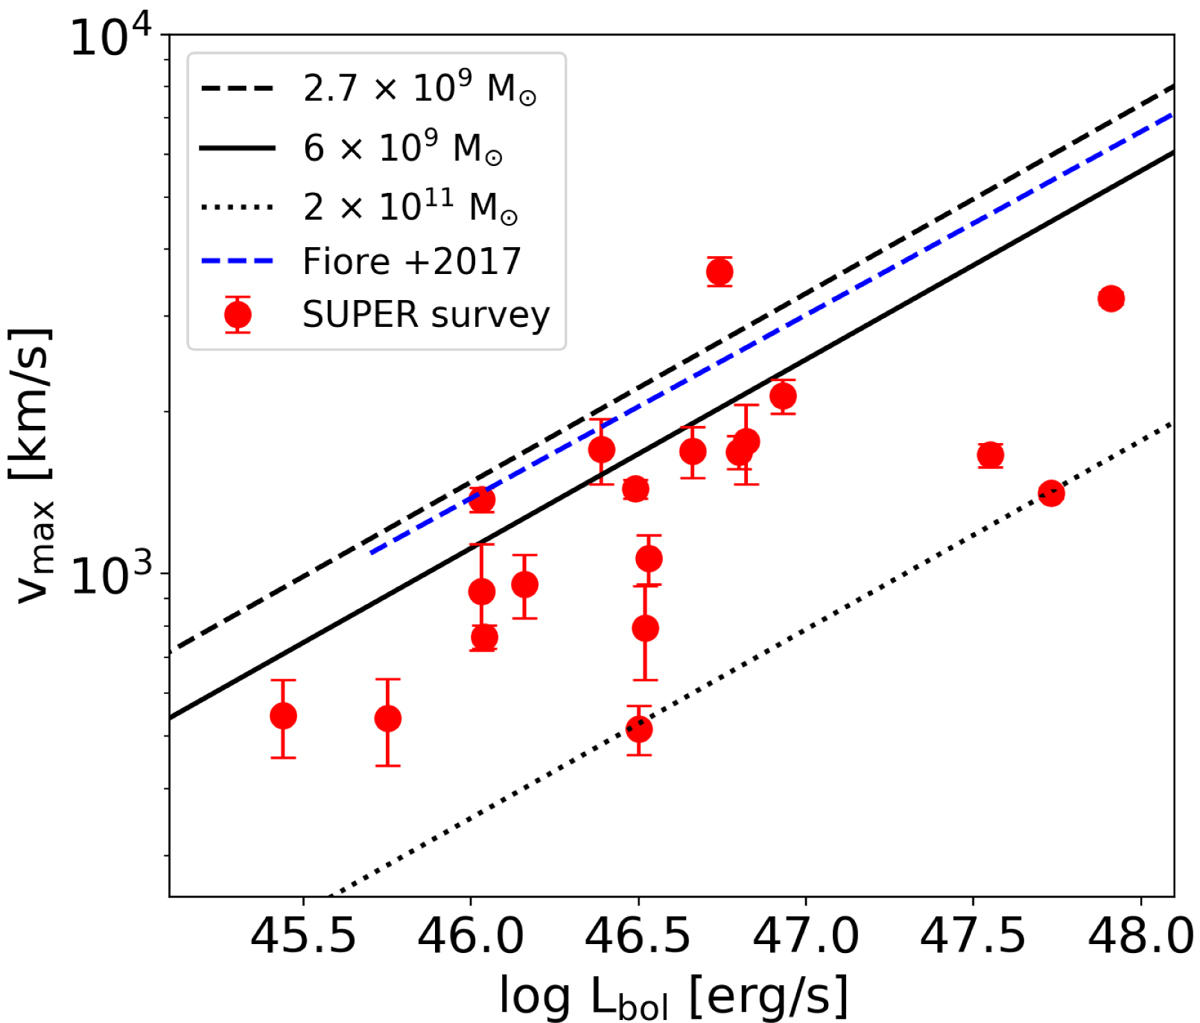
Maximum velocity, vmax, defined in Sect. 6, versus AGN bolometric luminosity. The red circles represent the SUPER targets, the dashed blue line shows the best fit relation for literature data compiled in Fiore et al. (2017). The black curves are the Menci et al. (2019) predictions for the shock velocity (approximated here by the measured vmax) versus AGN luminosity for galaxies. The three curves correspond to molecular gas masses of 2.7 × 10⁹ M⊙, 6 × 10⁹ M⊙ and 2 × 10¹¹ M⊙, respectively. More details are given in Sect. 6.
Current usage metrics show cumulative count of Article Views (full-text article views including HTML views, PDF and ePub downloads, according to the available data) and Abstracts Views on Vision4Press platform.
Data correspond to usage on the plateform after 2015. The current usage metrics is available 48-96 hours after online publication and is updated daily on week days.
Initial download of the metrics may take a while.