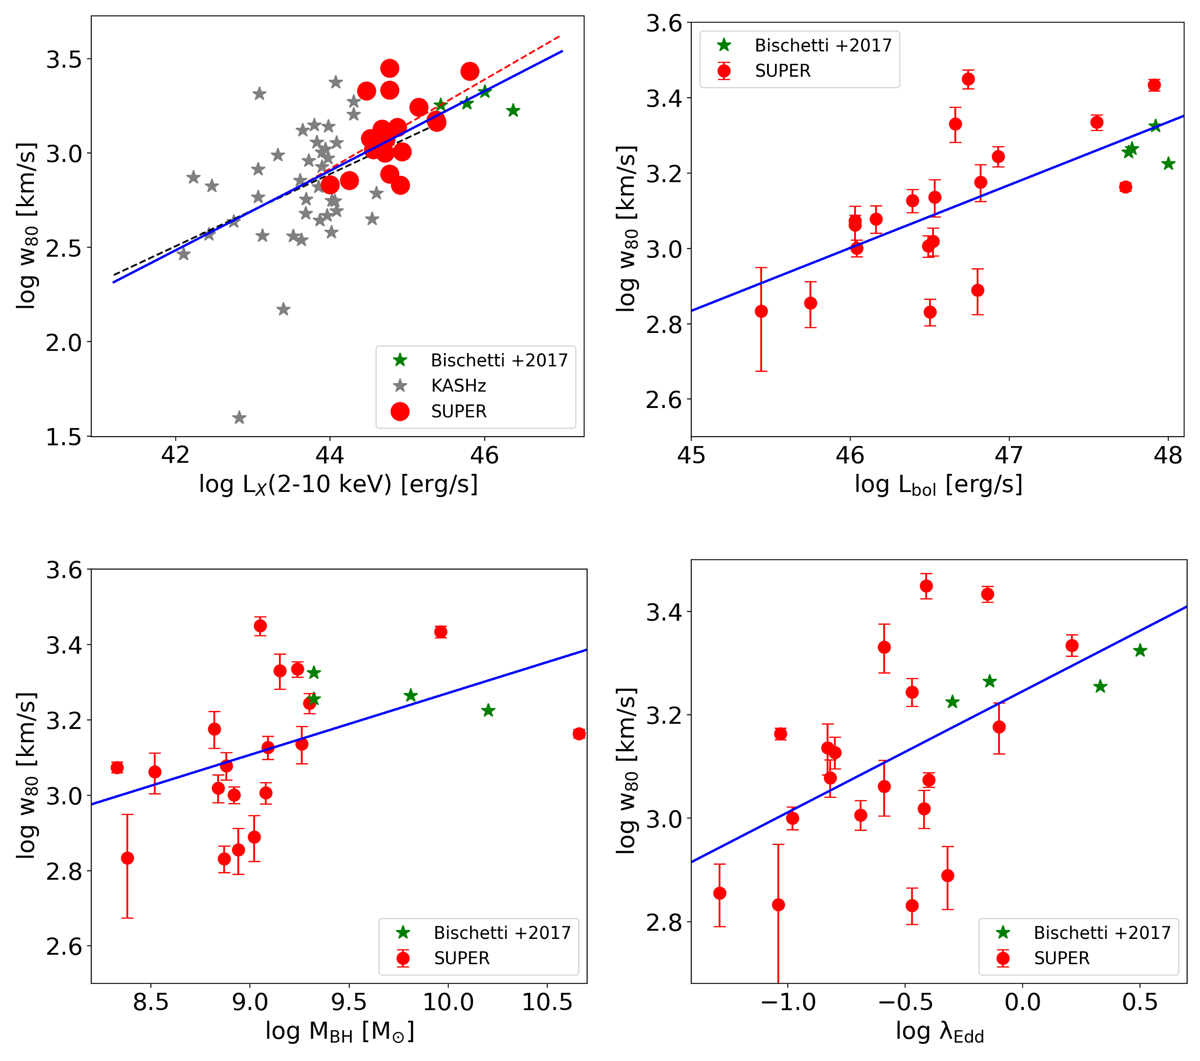
Fig. 12.
Top left panel: non-parametric velocity width, w80 derived from integrated spectrum versus X-ray luminosity measured in the 2–10 keV band. The red data points represent the SUPER sample, the grey data points show the luminosity and redshift-matched sample from the KASHz survey, and the green data points show the high-luminosity sample from the WISSH survey. The dashed red line shows the best fit relation for SUPER galaxies, the dashed grey line shows the best fit relation for the matched KASHz sample, and the blue line shows the overall relation for the SUPER, KASHz, and WISSH samples (Bischetti et al. 2017). Top right panel: w80 versus bolometric luminosity. Bottom left panel: w80 versus black hole mass, MBH. Bottom right panel: w80 versus Eddington ratio (Lbol/LEdd). In all the plots, the blue line shows the best fit to all the data points within the plot. The values plotted for the SUPER sample are obtained from Tables 1 and 3.
Current usage metrics show cumulative count of Article Views (full-text article views including HTML views, PDF and ePub downloads, according to the available data) and Abstracts Views on Vision4Press platform.
Data correspond to usage on the plateform after 2015. The current usage metrics is available 48-96 hours after online publication and is updated daily on week days.
Initial download of the metrics may take a while.