Fig. 11.
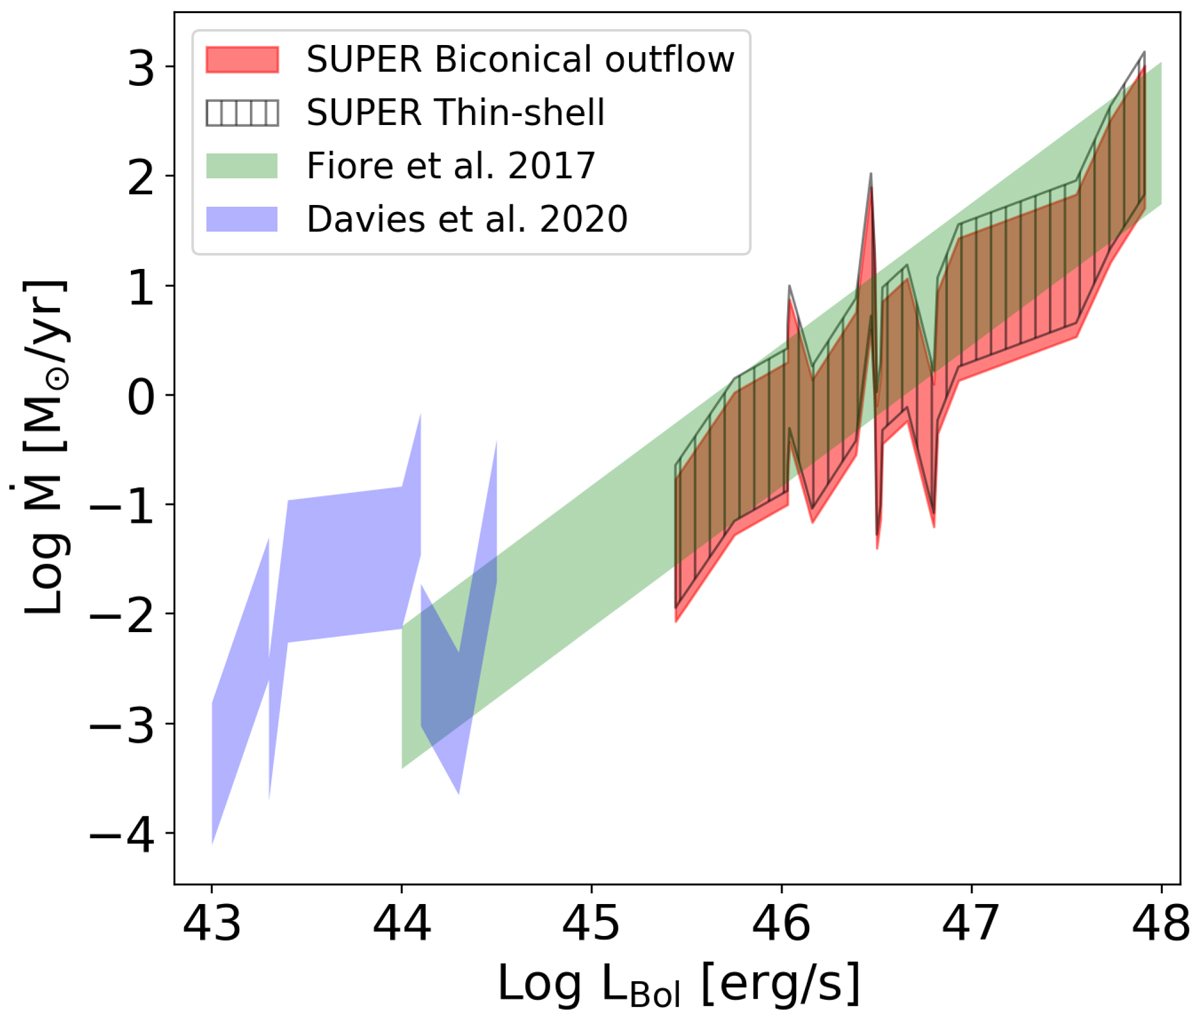
Ionised gas [O III] mass outflow rate versus bolometric luminosity of AGN for the SUPER Type 1 sample presented in this paper and literature data of low- and high-redshift AGN. The red shaded area and the black hatched area show the mass outflow rates for the SUPER targets assuming a biconical outflow model and a thin-shell model, as described in Sect. 5.5. The green shaded area shows the outflow rates for ionised gas from literature data compiled in Fiore et al. (2017) (after rescaling the relation with the same assumption as the Type 1 SUPER targets, see Sect. 5.5) and the blue shaded region shows the outflow rates for low redshift X-ray AGN sample from Davies et al. (2020b). The shaded region in all the studies correspond to mass outflow rates assuming an electron density from 500 cm−3–10 000 cm−3.
Current usage metrics show cumulative count of Article Views (full-text article views including HTML views, PDF and ePub downloads, according to the available data) and Abstracts Views on Vision4Press platform.
Data correspond to usage on the plateform after 2015. The current usage metrics is available 48-96 hours after online publication and is updated daily on week days.
Initial download of the metrics may take a while.