Open Access
Fig. 8.
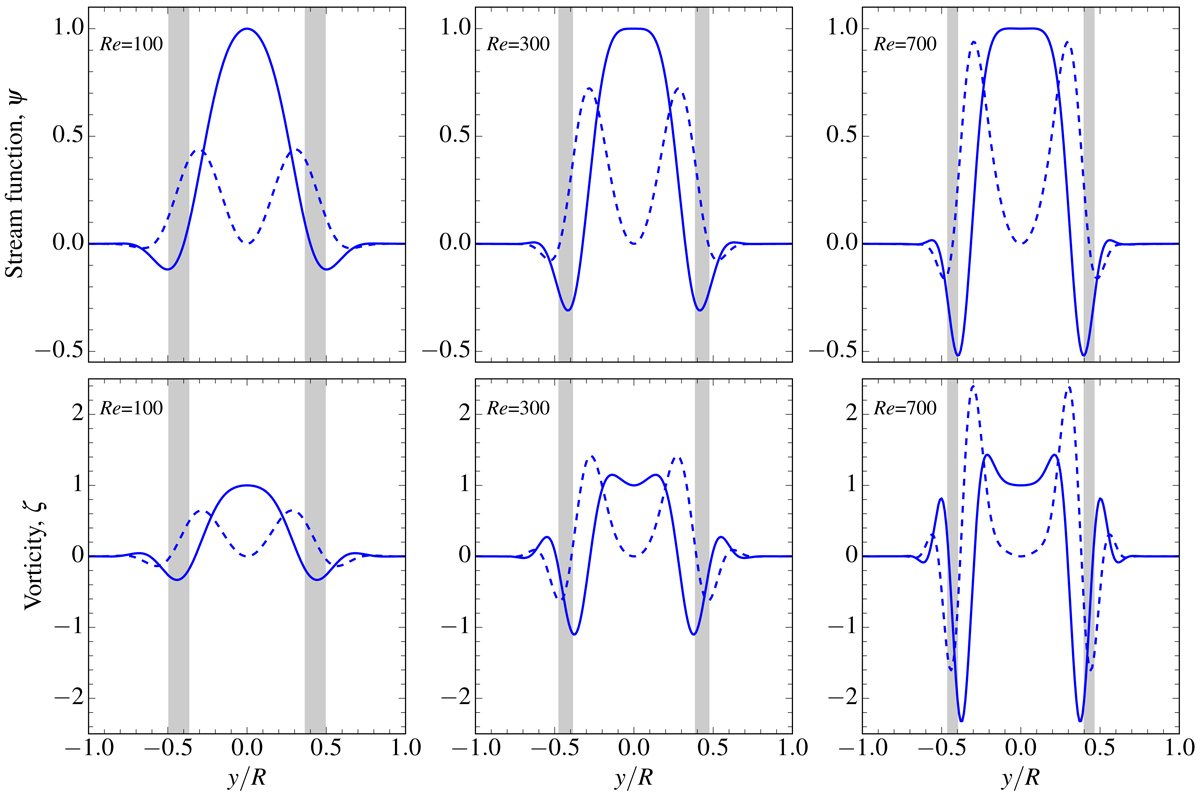
Stream function (top row) and vertical vorticity (bottom row) for R modes with kR = 10. The Reynolds number is Re = 100, 300, and 700 from left to right. The solid and dashed curves correspond to the real and imaginary parts. The shaded areas indicate the locations of the viscous critical layers for each value of Re.
Current usage metrics show cumulative count of Article Views (full-text article views including HTML views, PDF and ePub downloads, according to the available data) and Abstracts Views on Vision4Press platform.
Data correspond to usage on the plateform after 2015. The current usage metrics is available 48-96 hours after online publication and is updated daily on week days.
Initial download of the metrics may take a while.