Open Access
Fig. 6.
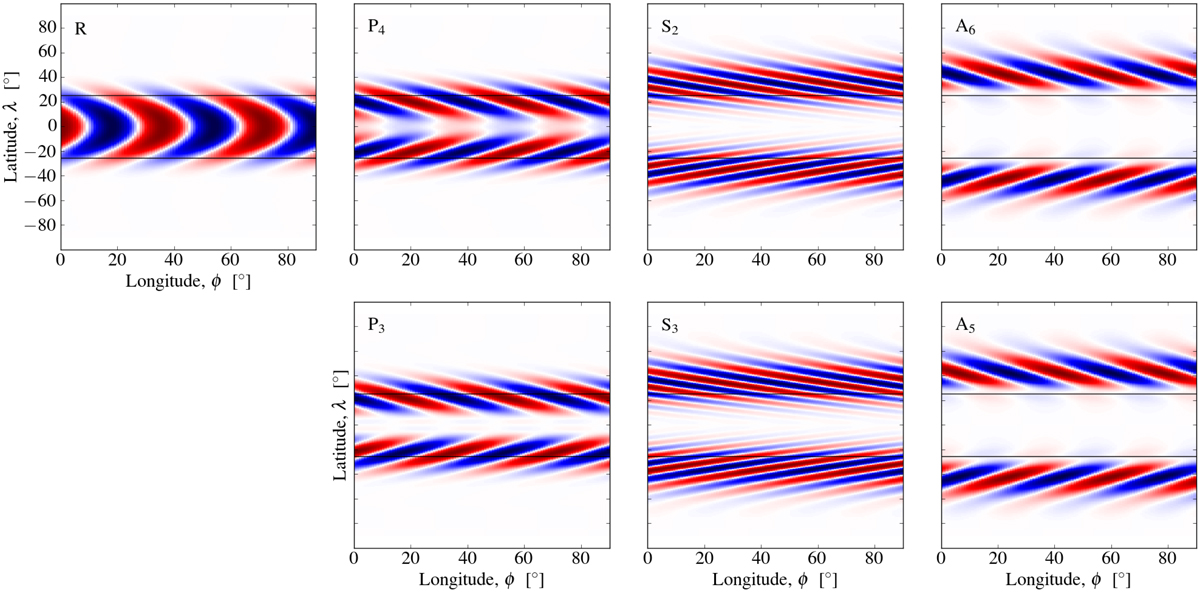
Stream functions in real space for all the modes shown in Fig. 5. The horizontal black lines show the central latitudes of the viscous layers, λ = ±25° for kR = 10. The R mode (top left panel) is confined to the equatorial region between the viscous layers.
Current usage metrics show cumulative count of Article Views (full-text article views including HTML views, PDF and ePub downloads, according to the available data) and Abstracts Views on Vision4Press platform.
Data correspond to usage on the plateform after 2015. The current usage metrics is available 48-96 hours after online publication and is updated daily on week days.
Initial download of the metrics may take a while.