Fig. 12.
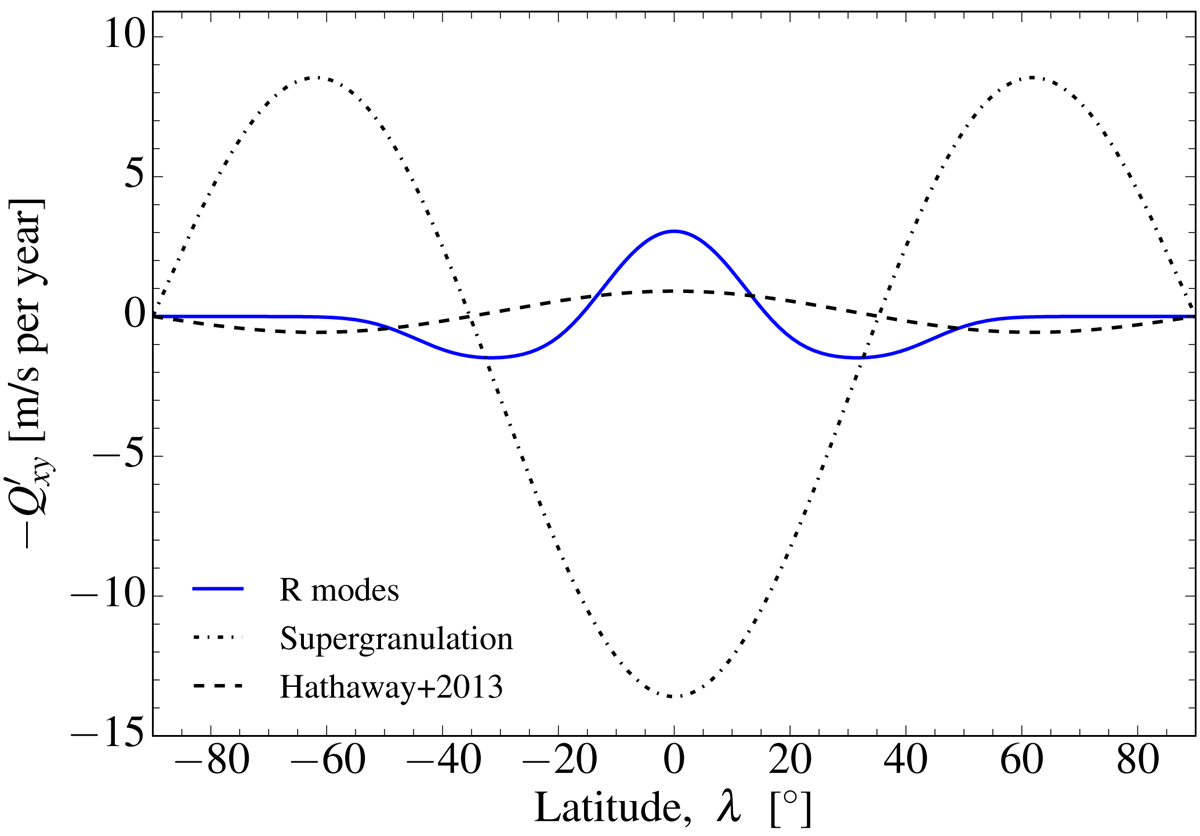
Equatorial acceleration −∂yQxy obtained by superposition of nine viscous R modes for kR = 7, 8, …15 (solid blue curve). The dot-dashed and dashed curves show −∂y⟨uxuy⟩ for supergranulation (Hanasoge et al. 2016, their Fig. 10) and larger-scale convection (Hathaway et al. 2013), respectively. For reference, the solar “torsional oscillation” has a typical amplitude of about ±5 m s−1 (see, e.g., Lekshmi et al. 2018).
Current usage metrics show cumulative count of Article Views (full-text article views including HTML views, PDF and ePub downloads, according to the available data) and Abstracts Views on Vision4Press platform.
Data correspond to usage on the plateform after 2015. The current usage metrics is available 48-96 hours after online publication and is updated daily on week days.
Initial download of the metrics may take a while.