Fig. 10.
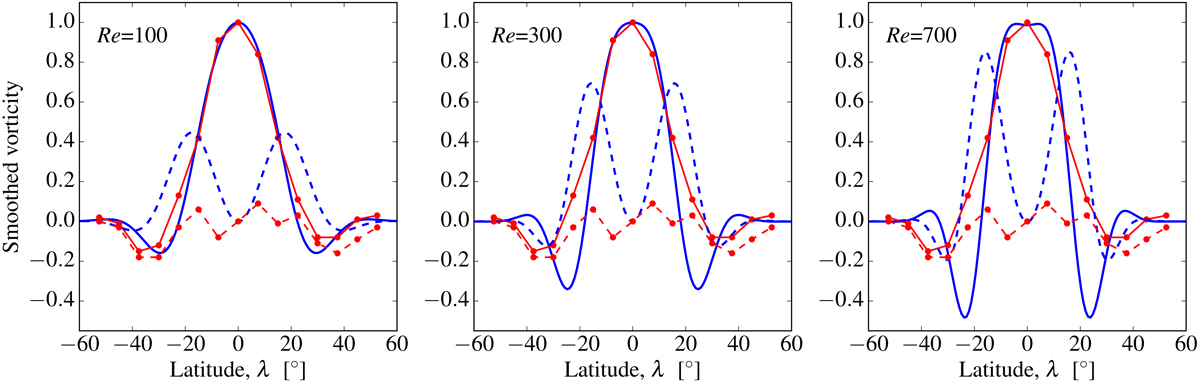
Real (blue solid lines) and imaginary (blue dashed lines) parts of the R-mode vertical vorticity at kR = 10 after smoothing the maps of horizontal velocities with a 2D Gaussian kernel with σ = 6°. Three different values of Re are shown. For comparison, the red curves with points show the ring-diagram helioseismic observations for m = 10 near the surface (Proxauf et al. 2020).
Current usage metrics show cumulative count of Article Views (full-text article views including HTML views, PDF and ePub downloads, according to the available data) and Abstracts Views on Vision4Press platform.
Data correspond to usage on the plateform after 2015. The current usage metrics is available 48-96 hours after online publication and is updated daily on week days.
Initial download of the metrics may take a while.