Fig. 1.
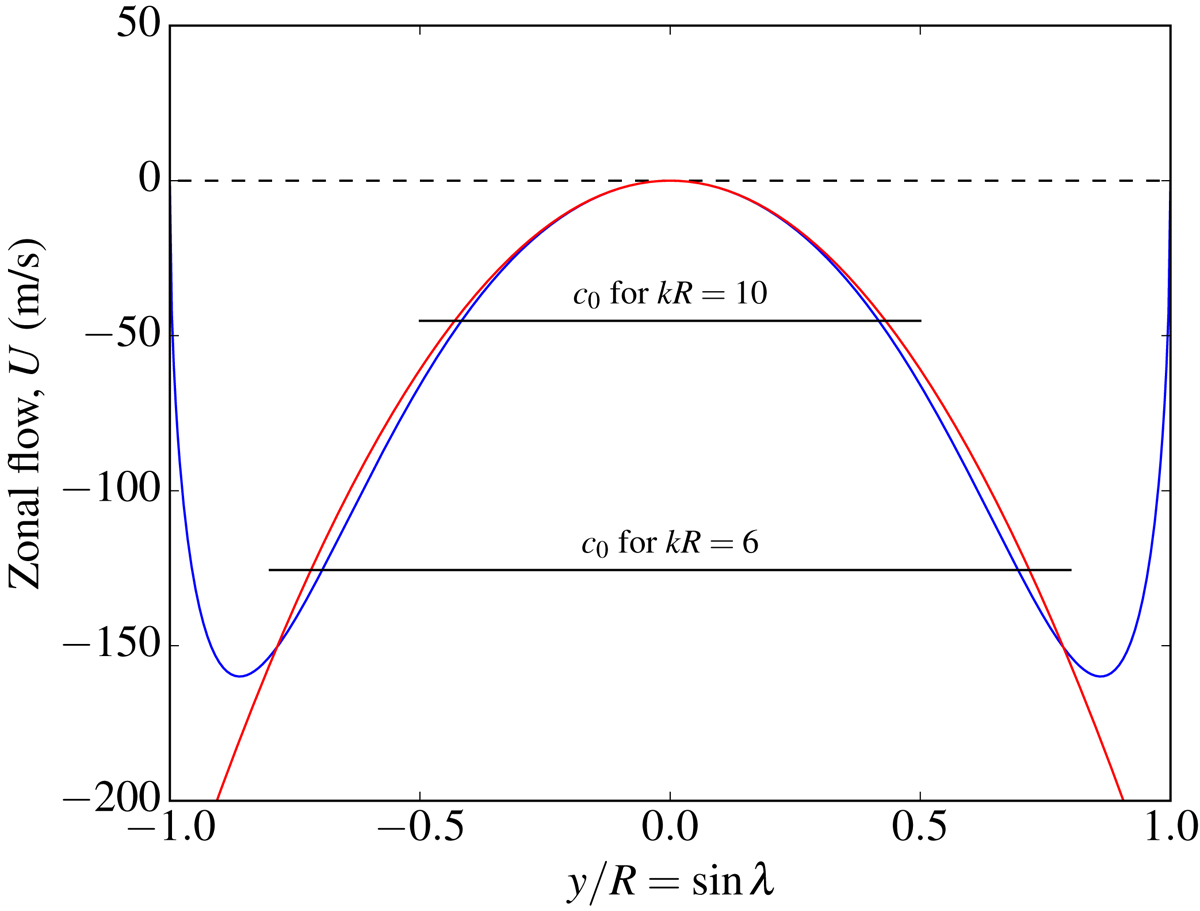
Parabolic zonal flow U (red curve, Eq. (4)) in the frame rotating at the equatorial rotation rate, which approximates the solar rotational velocity at the photosphere (blue curve). The horizontal black lines indicate the phase speed of Rossby waves, c0 = −(β − U″)/k2, for longitudinal wavenumbers kR = 6 and kR = 10. At critical latitudes, U = c0.
Current usage metrics show cumulative count of Article Views (full-text article views including HTML views, PDF and ePub downloads, according to the available data) and Abstracts Views on Vision4Press platform.
Data correspond to usage on the plateform after 2015. The current usage metrics is available 48-96 hours after online publication and is updated daily on week days.
Initial download of the metrics may take a while.