Fig. 8.
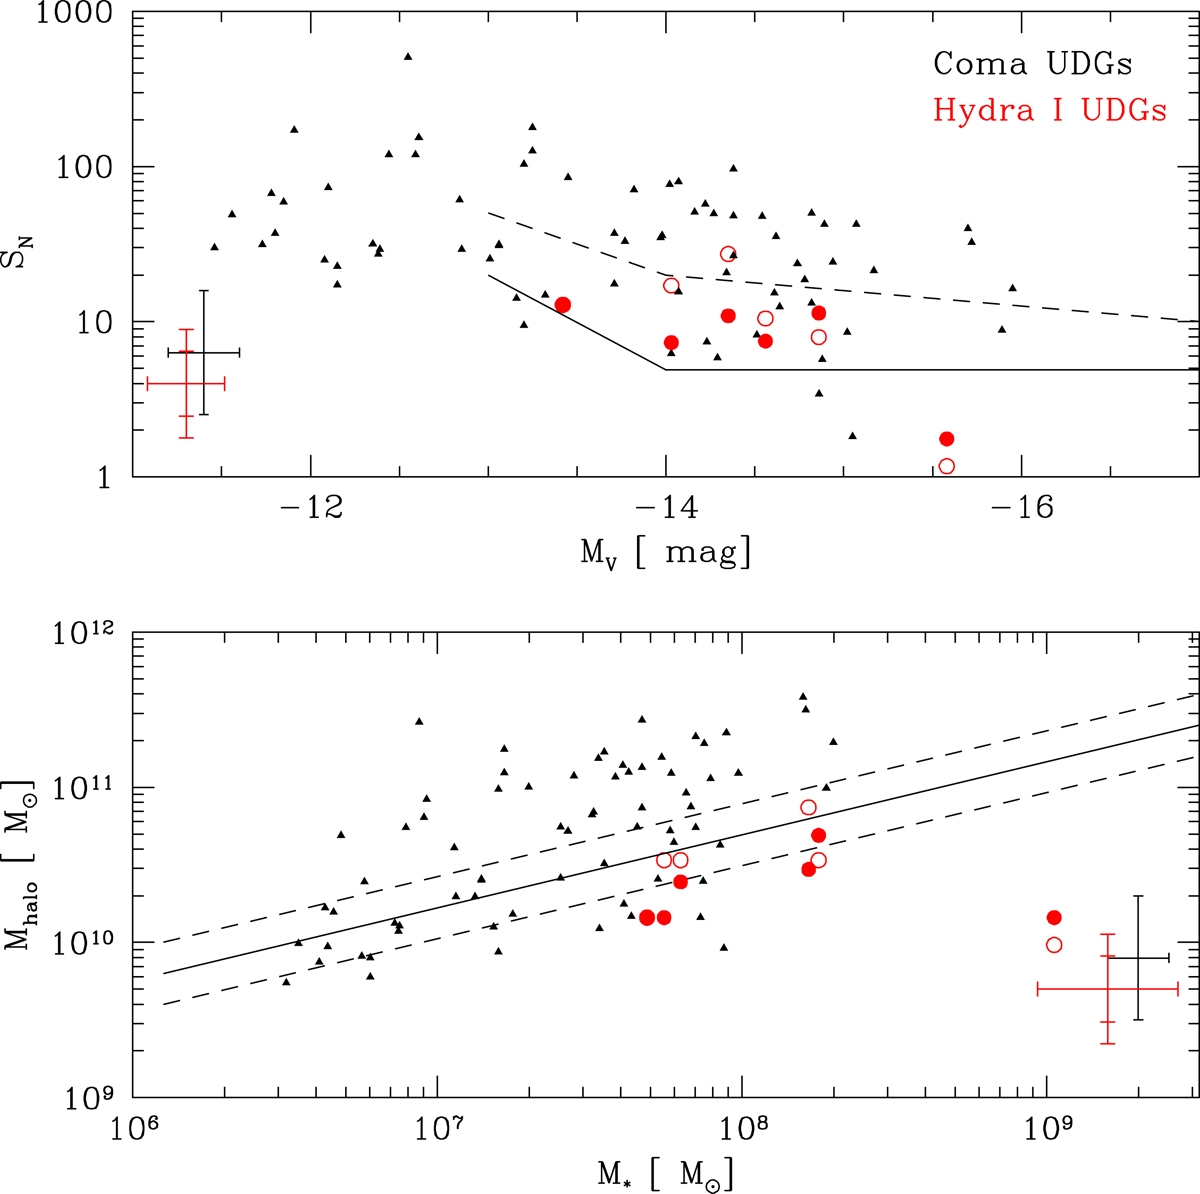
Upper panel: GCs specific frequency SN versus V-band absolute magnitude for the Hydra I UDG sample (red), compared with the UDGs in the Coma cluster (black triangles) by Forbes et al. (2020a). For the UDGs in Hydra I, the filled red circles are for values derived inside 5Re, empty red circles for values derived inside 1.5 Re. The solid line shows the mean locus of dwarf galaxies, the dotted line represents the upper 2σ bound (see also Fig. 4 in Lim et al. 2018). The average uncertainties on both samples are shown in the lower left corner. Lower panel: Halo mass versus stellar mass. The halo for the UDGs in Hydra I is derived from the total number of GCs, using the scaling relation by Burkert & Forbes (2020), see text for details. Symbols are the same as in upper panel. The average uncertainties on both samples are plotted in the lower right corner. The black solid line is the extrapolated stellar mass-halo mass relation for normal galaxies by Rodríguez-Puebla et al. (2017), with a scatter of ±0.2 dex (dashed lines).
Current usage metrics show cumulative count of Article Views (full-text article views including HTML views, PDF and ePub downloads, according to the available data) and Abstracts Views on Vision4Press platform.
Data correspond to usage on the plateform after 2015. The current usage metrics is available 48-96 hours after online publication and is updated daily on week days.
Initial download of the metrics may take a while.