Fig. 5.
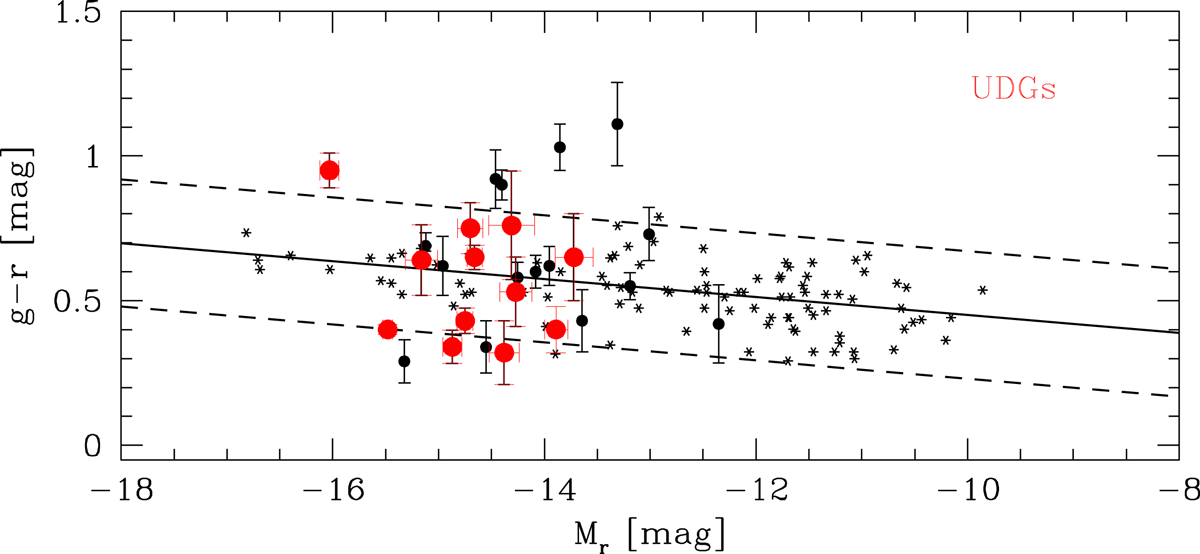
colour-magnitude diagram (CMD) for the full sample of LSB galaxies (black points) detected in the VST Hydra I mosaic. Red filled circles indicate the UDG candidates. The solid black line is the CM relation for the Hydra I cluster galaxies derived by Misgeld et al. (2008, dashed lines indicate the 2σ scatter). The asterisks indicate dwarf galaxies from Misgeld et al. (2008).
Current usage metrics show cumulative count of Article Views (full-text article views including HTML views, PDF and ePub downloads, according to the available data) and Abstracts Views on Vision4Press platform.
Data correspond to usage on the plateform after 2015. The current usage metrics is available 48-96 hours after online publication and is updated daily on week days.
Initial download of the metrics may take a while.