Fig. 4.
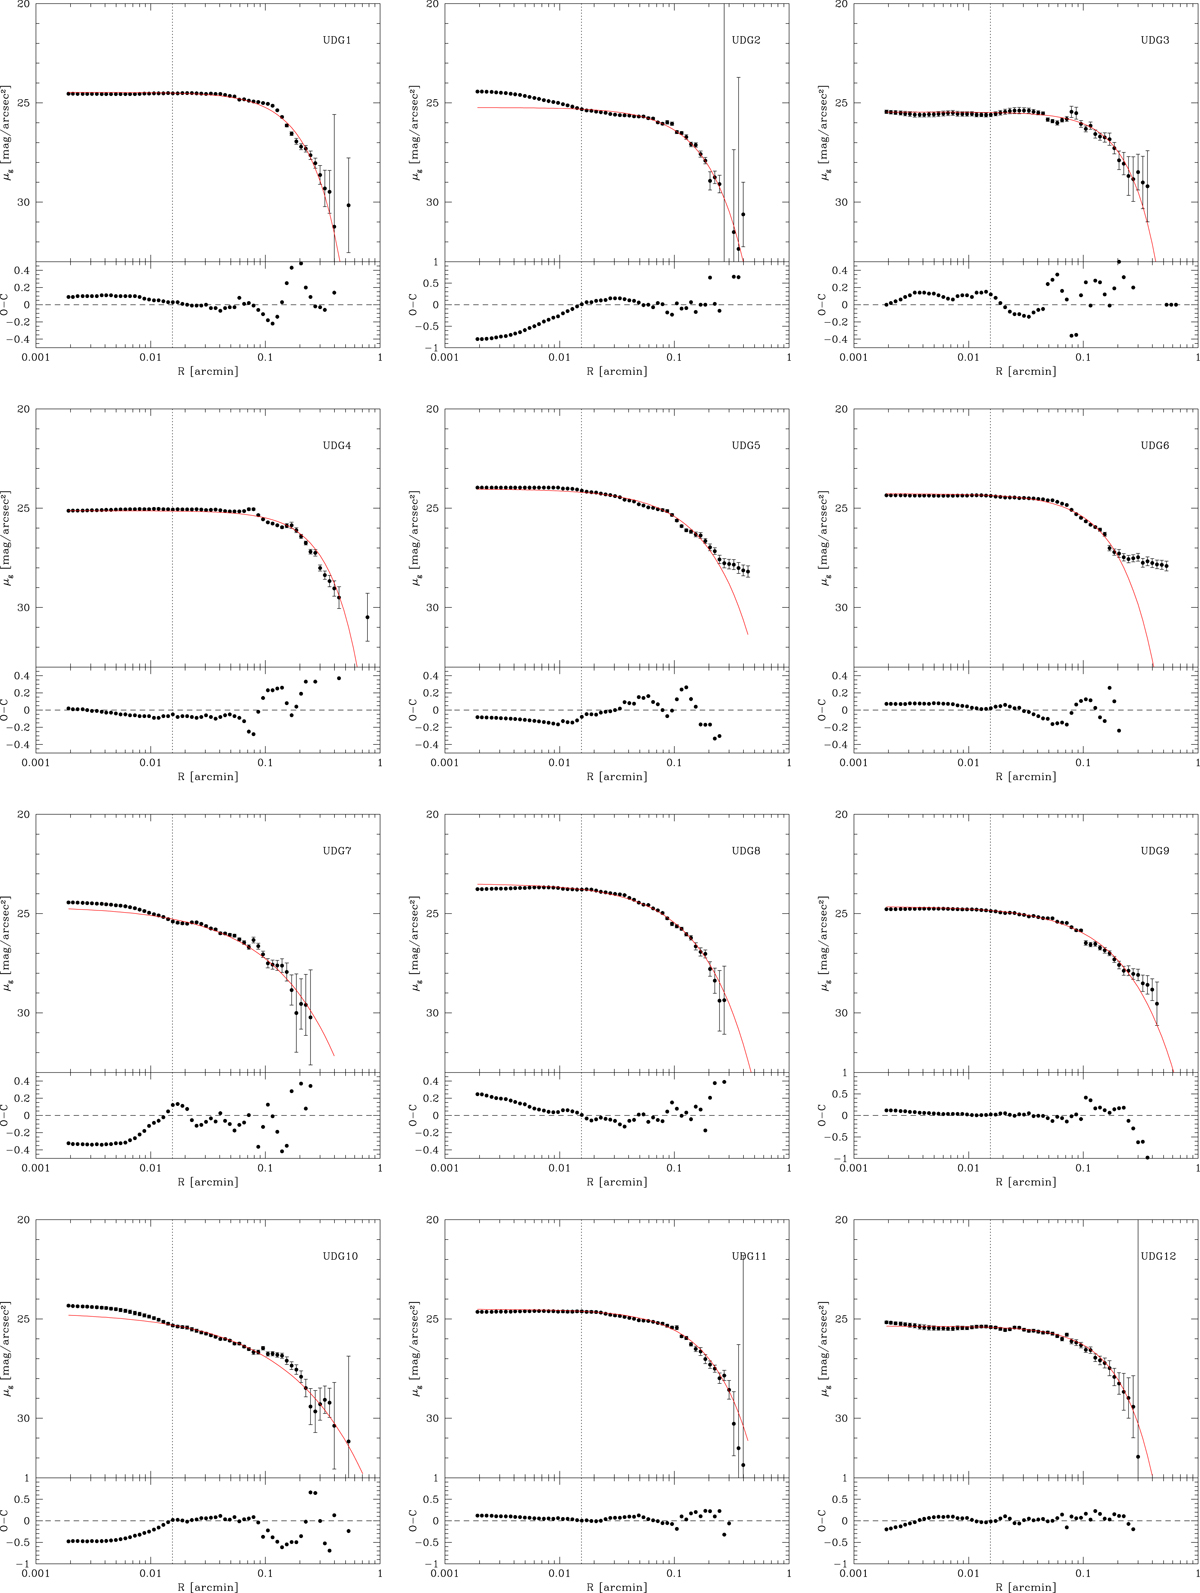
Azimuthally averaged surface brightness profiles in the g band for the UDGs candidates (top panels). The red line indicates the best fit of the azimuthally averaged surface brightness profile derived from the 2D fit of the light distribution, using GALFIT. The vertical dotted line indicates the inner regions excluded from the fit, inside the seeing disc. The residuals of the fit are shown in the lower panels.
Current usage metrics show cumulative count of Article Views (full-text article views including HTML views, PDF and ePub downloads, according to the available data) and Abstracts Views on Vision4Press platform.
Data correspond to usage on the plateform after 2015. The current usage metrics is available 48-96 hours after online publication and is updated daily on week days.
Initial download of the metrics may take a while.