Fig. A.1
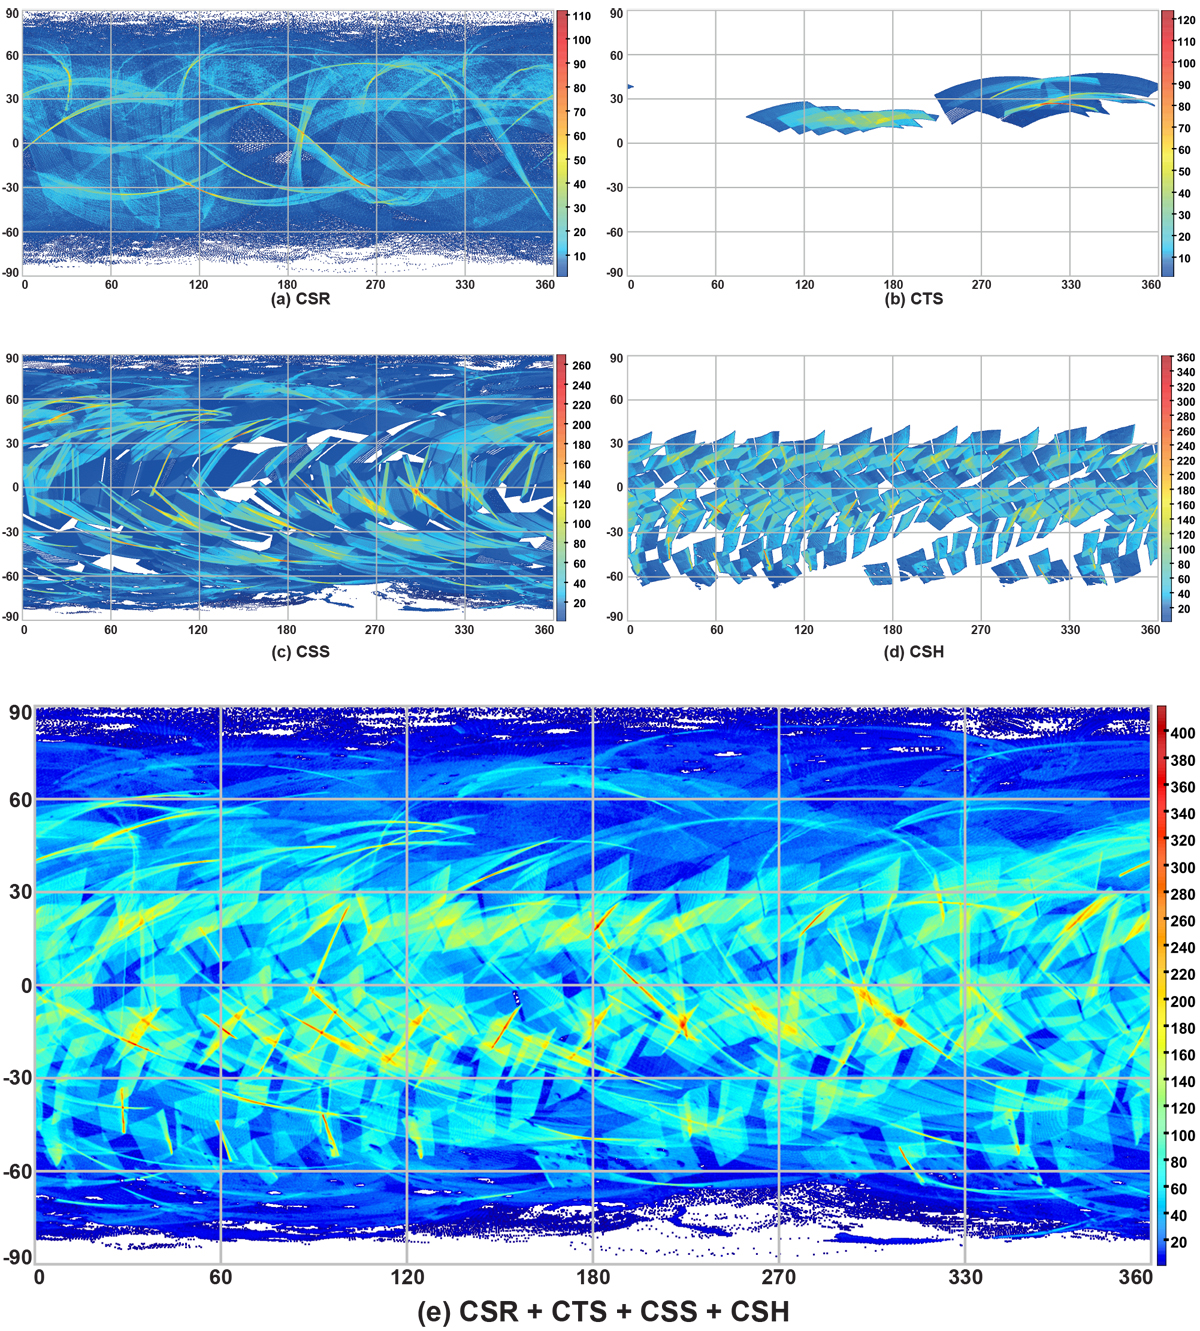
Density maps of the VIR visible data set used in the study. Panel A: CSR mission phase; panel B: CTS; panel C: CSS; panel D: CSH; and panel E: regroups every four. For details about the mission phases, see Table 1 and Sect. 2.2. Each map is built with TOPCAT with a Plate Carée projection (see Sect. 2.4), and observations are represented as points. The scale corresponds to the square root of the observation density.
Current usage metrics show cumulative count of Article Views (full-text article views including HTML views, PDF and ePub downloads, according to the available data) and Abstracts Views on Vision4Press platform.
Data correspond to usage on the plateform after 2015. The current usage metrics is available 48-96 hours after online publication and is updated daily on week days.
Initial download of the metrics may take a while.