Fig. 4.
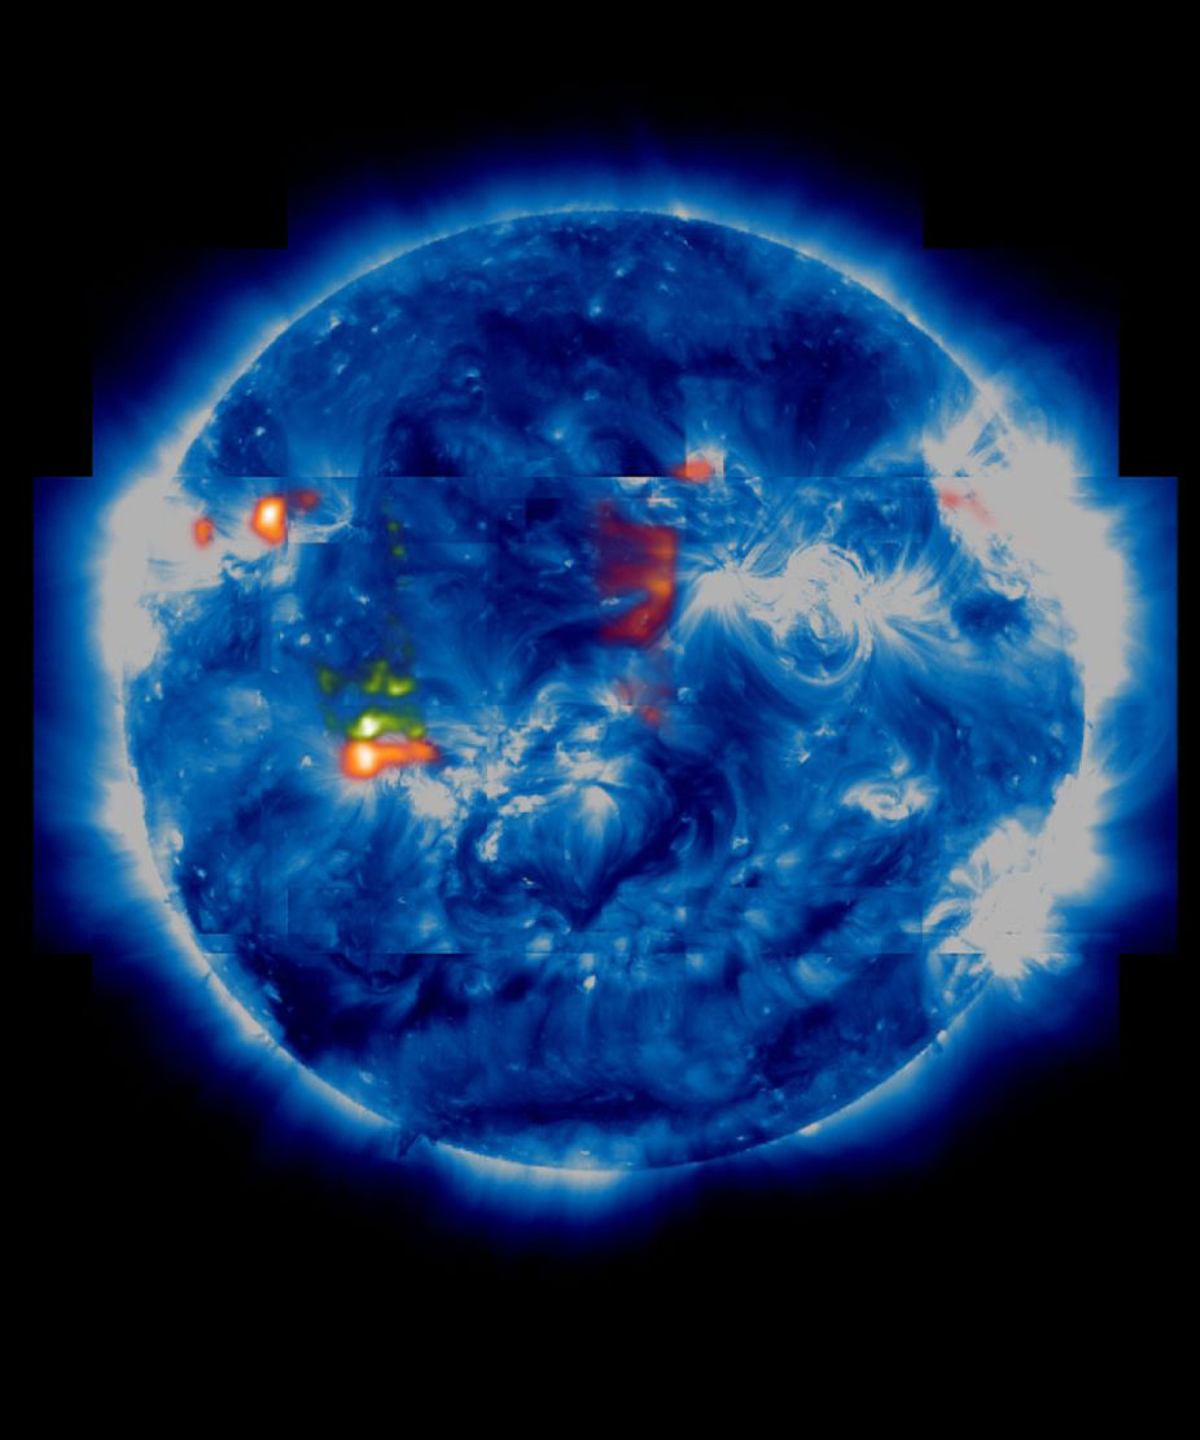
Source regions of the slow solar wind. The background image is an SDO/AIA image in the 193 Å band. The sources overlaid on this image are all potential regions where coronal plasma with slow-wind composition is outflowing on open field lines that reach close to the ecliptic plane. The red sources are the larger concentrations of such sources and the green regions are the weaker ones (from Brooks et al. 2015, figure under Creative Commons License, https://creativecommons.org/licenses/by/4.0/).
Current usage metrics show cumulative count of Article Views (full-text article views including HTML views, PDF and ePub downloads, according to the available data) and Abstracts Views on Vision4Press platform.
Data correspond to usage on the plateform after 2015. The current usage metrics is available 48-96 hours after online publication and is updated daily on week days.
Initial download of the metrics may take a while.