Fig. 30.
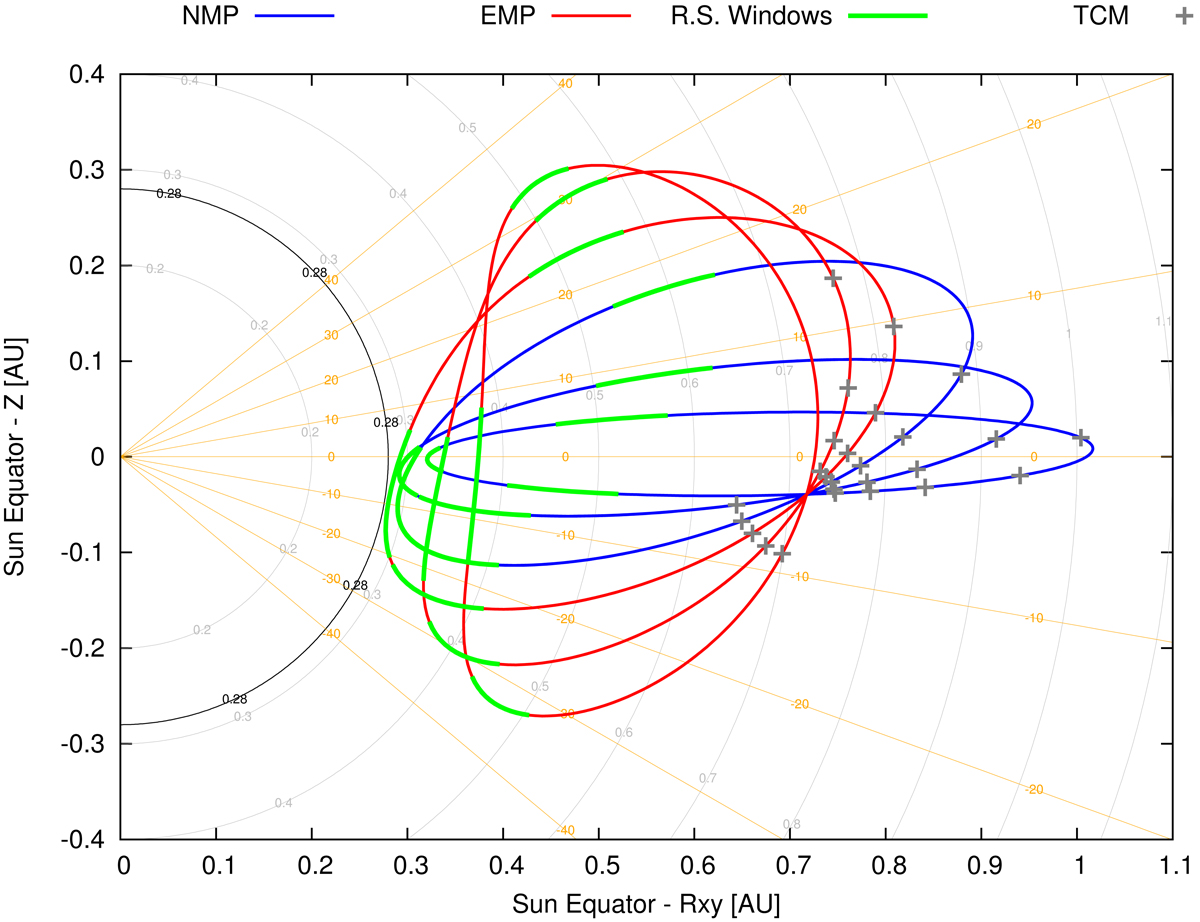
Projection of science orbits. The spacecraft traces the orbits in clockwise direction. Vertical distance (Z) to the solar equatorial plane is plotted as a function of radial distance to the Sun in that (X–Y) plane. The blue line denotes the nominal mission (NMP), the red line the extended mission phase (EMP). For all orbits, the default remote-sensing windows are over-plotted in green. Lines of constant solar latitude are indicated in orange in increments of 10°, and the minimum perihelion distance is plotted as a black semi-circle. The grey crosses indicate the trajectory correction manoeuvres used for the Venus GAMs.
Current usage metrics show cumulative count of Article Views (full-text article views including HTML views, PDF and ePub downloads, according to the available data) and Abstracts Views on Vision4Press platform.
Data correspond to usage on the plateform after 2015. The current usage metrics is available 48-96 hours after online publication and is updated daily on week days.
Initial download of the metrics may take a while.