Fig. 3.
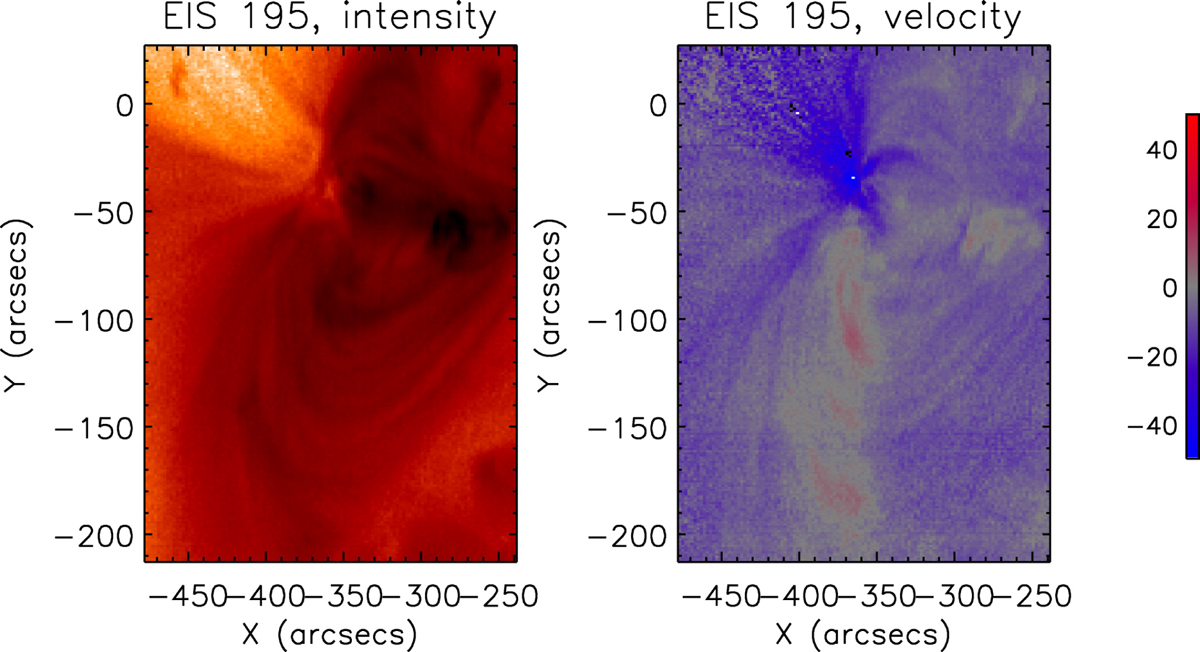
Hinode/EIS raster scan of an active region. Left image: intensity of the Fe XII emission line, right image: Doppler velocity determined from that line. The strongest blueshifts are occur in the lower-intensity region at the edge of the active region, seen on the left-hand side (from Harra et al. 2008, reproduced by permission of the AAS).
Current usage metrics show cumulative count of Article Views (full-text article views including HTML views, PDF and ePub downloads, according to the available data) and Abstracts Views on Vision4Press platform.
Data correspond to usage on the plateform after 2015. The current usage metrics is available 48-96 hours after online publication and is updated daily on week days.
Initial download of the metrics may take a while.